5.0
0
4.0
10
3.0
20
100 Cg
α ()
Northern
H
emisphere
2.0
30
1.0
40
h / z 0 = 5.0 10 5
0
50
150
100
50
0
50
100
150
= h/L
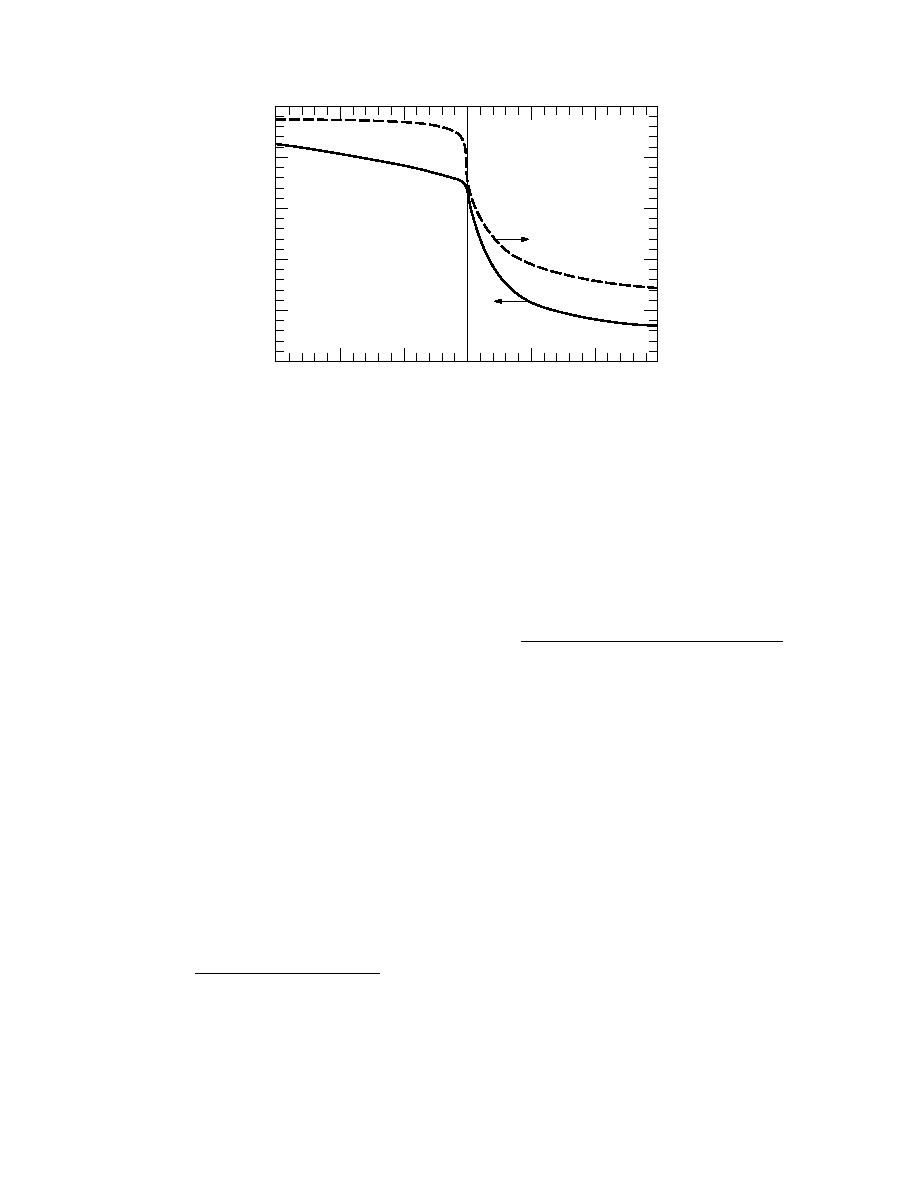
Figure 30. Geostrophic drag coefficient (Cg) and the turning angle (α) as functions of
stability when Yamada's (1976) A and B functions (eq 157158) are used in eq 161 and
163, respectively. To make this calculation, I used h/z0 = 5.0 105. The α values are for the
Northern Hemisphere; Southern Hemisphere values have the opposite sign.
Earlier, I showed that the surface-layer neutral-
interpretation of A and B. In unstable conditions, Cg is
stability drag coefficient at 10 m (CDN10) is mono-
large and α is near zero. As a result, the surface stress
tonically related to z0. We can use that relation, eq 105,
responds strongly to geostrophic forcing. And because
here to relate CgN and CDN10. Equation 164 thus be-
of this strong coupling, the ABL is well mixed so the
comes
turning of the wind vector with height is small. On the
other hand, in very stable conditions, Cg is smaller and
k
α is larger in magnitude. That is, because the stratifica-
CgN =
[
]
1/ 2
k C 1/2 + ln(h / 10) - A(0)
2
2
+ B(0)
tion suppresses the vertical turbulent exchange, the sur-
DN10
face stress is less responsive to the geostrophic forcing.
(165)
Also with less efficient vertical coupling, the wind vec-
tor can rotate more with height because the upper-level
where h must be in meters.
winds have little opportunity to mix their longitudinal
We see two effects here. As CDN10 increases, so does
momentum down into the ABL.
CgN. But as the ABL gets deeper (i.e., as h increases),
Brown (1981, 1990), Overland and Davidson (1992)
CgN decreases if CDN10 remains constant. This latter
and Overland and Colony (1994) showed some alter-
effect is analogous to what we see in the surface-layer
native formulations for Cg and α over sea ice and also
bulk-transfer coefficients. Equations 105107 show that
presented Cg and α data that came from Arctic sea ice
CDNr, CHNr and CENr all decrease as the reference height
regions. Although their data and the computed param-
r increases. The reason is that the forcing quantities
eters in Figure 30 may differ in detail, the trends and
Ur 0, Ts Θr and Qs Qr (see eq 9193) all increase
the general magnitudes of the quantities agree.
in magnitude with r; thus, the corresponding transfer
As we did in the atmospheric surface layer, we can
coefficient can decrease proportionately.
also write an expression for the geostrophic drag coef-
From eq 164 we can also solve for z0 in terms of
ficient at neutral stability. From eq 161, this is
CgN
(
)
1 / 2
z0 ef = h exp- A(0) + (k / CgN )2 - B(0)2
k
CgN =
.
{[ln(h / z ) - A(0)] + B(0) }
.
(164)
1/ 2
2
2
0
(166)
Yamada's (1976) functions (eq 157158) suggest that
Since this roughness length derives from Ekman layer
A(0) = 1.855 and B(0) = 3.020. For comparison,
parameters, it is the effective roughness length (Fiedler
Zilitinkevich (1989b) recommended A(0) = 1.7 and
and Panofsky 1972, Arya 1975, Mason 1988, Claussen
B(0) = 4.5 after an extensive review.
1990) in contrast to the local roughness length, which
33


 Previous Page
