where, for convenience, I have dropped the subscript P
104
172 220
49
23
5.2
282
that appeared in eq 135. For illustrative purposes, sup-
134
1.2
363
11
2.4
466
pose
18.4
599
Ug (0)
769
ln T
Thermal Wind
=m
220
769
(137a)
104 134
y
283
49
23
172
363
11
5.2
599
466
2.4
ln T
1.2
=n
(137b)
x
26.8
Ug (0)
where m and n are constants (e.g., Sorbjan 1989, p. 179).
Then eq 136 simply become
23 49
104
134
5.2
171
1.2
11
220
2.4
17.7
Ug(z) = Ug(0) mgz/f
(138a)
283
Ug (0)
363
Vg(z) = Vg(0) + ngz/f .
(138b)
104 134
466
172
23
49
220
5.2
599
11
1.2
282
That is, in this example, the baroclinicity causes the
2.4
769
363
geostrophic wind components to increase or decrease
466
26.3 1267
987
987
Ug (0)
with height depending on the direction of the gradient
598
769
Thermal Wind
in surface temperature.
1268
Again, it is hard for me to remember the direction in
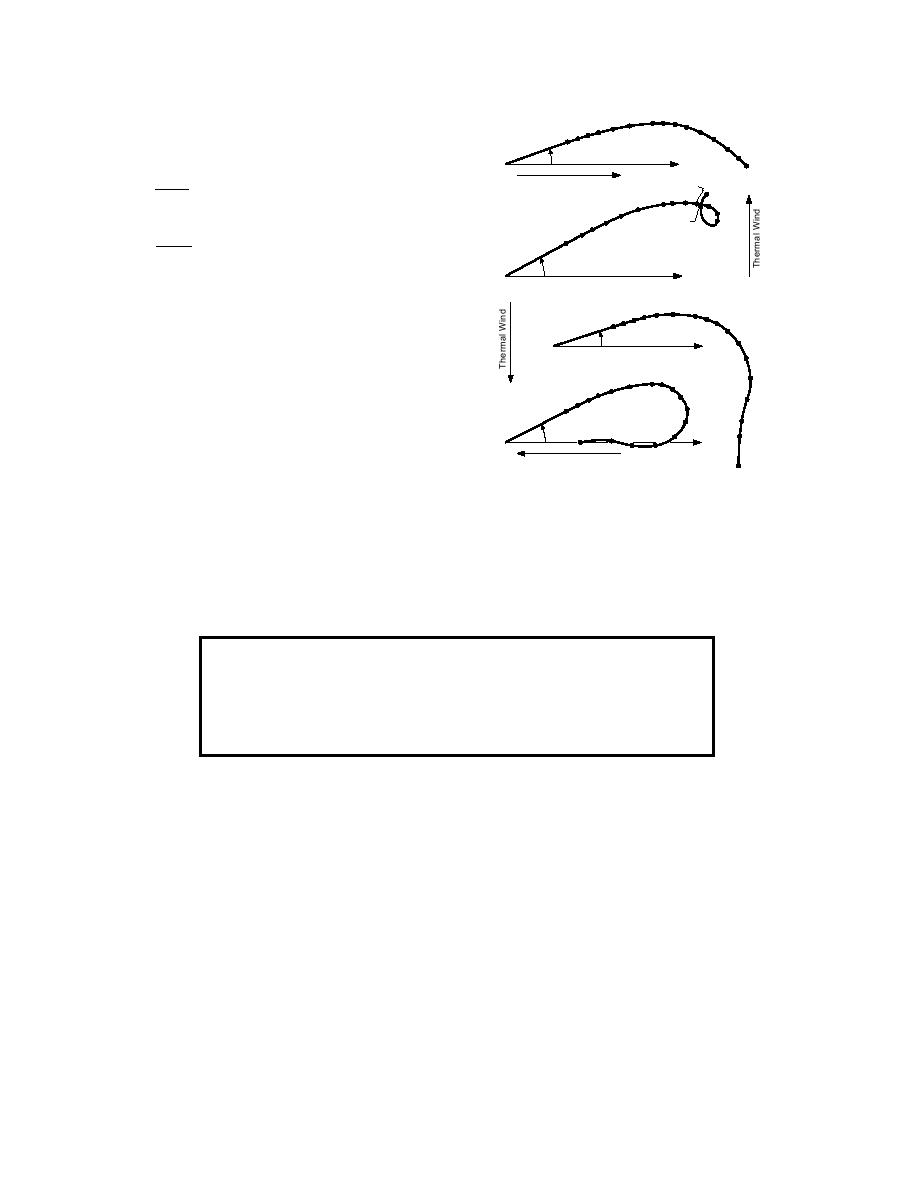
Figure 24. Northern Hemisphere hodographs of Ekman
which the geostrophic wind will change in response to
spirals in the presence of a constant thermal wind. The
a surface temperature gradient. I, thus, developed an-
thermal wind effect is modeled as in eq 138; the magnitude
other right-hand rule.
of the plotted thermal wind vector is roughly mgz/f (or
For practice with this rule, suppose you are over sea
ngz/f) for z of 800900 m. The surface-level geostrophic
ice in the Weddell Sea (i.e., in the Southern Hemi-
wind is labeled Ug(0). The numbers near the dots indicate
sphere). There is open water to the east; thus, the posi-
the height in meters (after Blackadar 1963; see also Brown
tive temperature gradient points east. Suppose the sur-
1974).
A Right-Hand Rule for the Thermal Wind
1. Point the fingers of the right hand in the direction of f. (f is up in the Northern
Hemisphere; down in the Southern Hemisphere.)
2. Curl the fingers in the direction of the positive temperature gradient.
3. The right thumb then points in the direction in which the geostrophic wind
increases with height.
face geostrophic wind is blowing due north. According
ROSSBY NUMBER SIMILARITY
to the above rule, Vg must increase with height to the
As I have hinted, the Ekman solution has shortcom-
south. That is, Vg(z) will get smaller with height and
ings. In particular, it predicts a low-speed layer at the
may even turn negative (i.e., the wind may blow
surface that is fairly thick (see Fig. 22). In reality, the
toward the south at some height).
wind speed increases rapidly above the surface; at a
Sorbjan (1989, p. 179 f.) showed how to incorpo-
height of only 1 m, it is already an appreciable fraction
rate simple thermal wind parameterizations like eq 138
of the geostrophic wind speed (e.g., see Fig. 6). Con-
into the Ekman solutions. The result is a distorted
versely, the surface-layer profiles I described in earlier
Ekman spiral whose shape depends on the relative mag-
sections are not accurate for heights above, roughly,
nitudes and directions of the surface geostrophic wind
1
/10 the height of the ABL. Blackadar and Tennekes
and the horizontal temperature gradient. Figure 24
(1968), however, demonstrated that, by matching
shows some similarly modified Ekman spirals from
surface-layer and Ekman-layer solutions in a region
Blackadar (1963). Clearly, the presence of a thermal
where they overlap, it is possible to mathematically
wind can hide the Ekman spiral.
describe the entire ABL with an extended Ekman solu-
tion that also treats stability effects.
27


 Previous Page
