Temperature (C)
12
10
8
6
4
800
IS051500
V
U Component
T Component
600
emperature
400
200
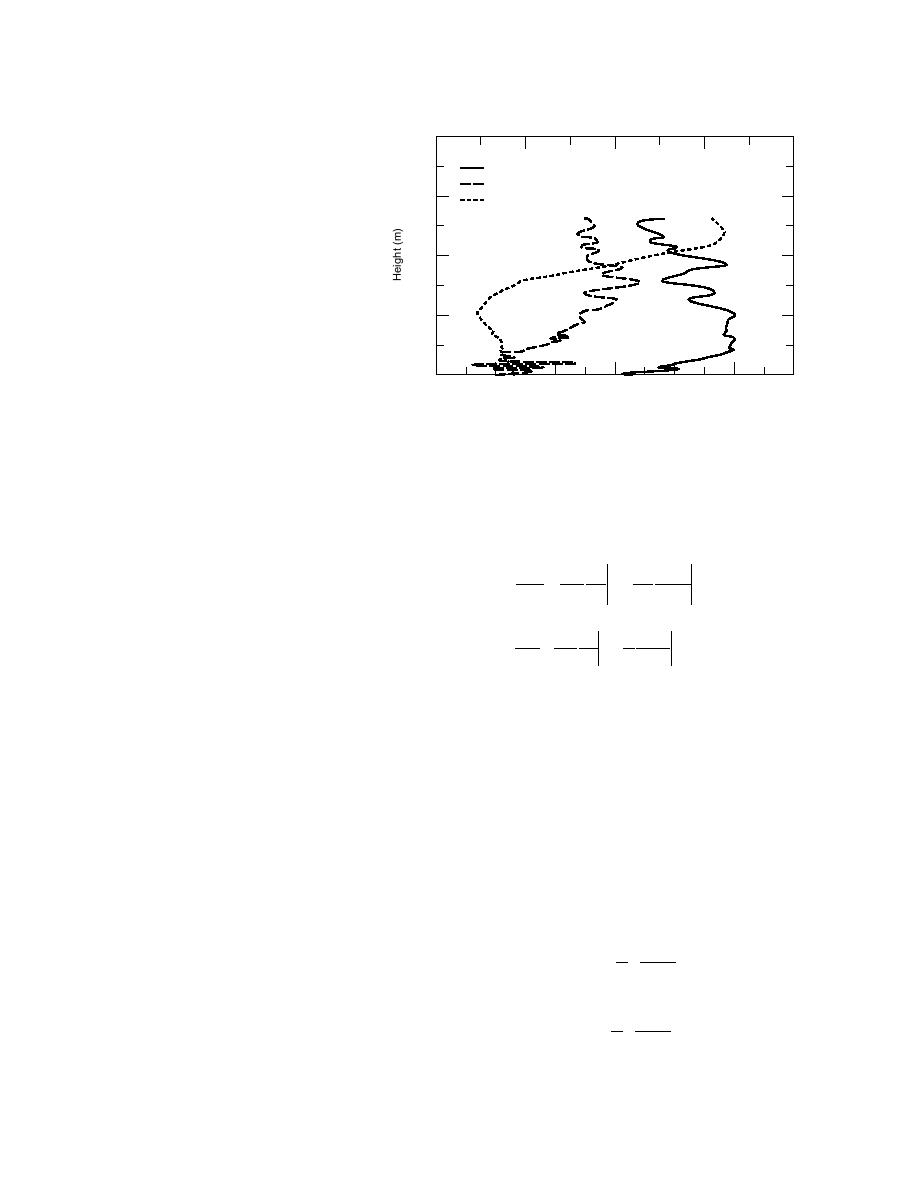
Figure 23. The 00 GMT radiosounding from
Ice Station Weddell on 15 May 1992. The coor-
dinate system is such that the surface wind has
0
2
0
2
4
6
8
10
no transverse component (i.e., the coordinate
system is aligned with the surface stress).
Wind Vector (m/s)
tinctly supergeostrophic; it has a bulge near z/δ = π/2
Remember, eq 15 defined the geostrophic wind com-
where U ′ > Ug . The transverse velocity component is
′
ponents. Suppose, rather than being constant as Ekman
also a bit supergeostrophic just below z/δ = π. Notice,
assumed, the geostrophic wind varies with height. On
too, for z > πδ = hE, the wind vectors are approximately
using the ideal gas law, eq 5, and taking the z derivative
geostrophic.
in eq 15, we can show (e.g., Arya and Wyngaard 1975;
The question now becomes: How realistic is the
Sorbjan 1989, p. 177 f.)
Ekman solution; is the Ekman spiral, for example, ever
observed in nature? We made a lot of radiosounding pro-
-g T
-g ln T
Ug
=
=
(135a)
files on Ice Station Weddell (Claffey et al. 1994); it would
fT y
f
y
z
be reasonable to look through these for evidence of an
P
P
Ekman layer. But remember, the Ekman layer is derived
Vg
assuming neutral stratification. On ISW, stable stratifica-
g T
g
ln T
=
=
,
(135b)
tion was the norm. Figure 23 does, however, show one
fT x P f
x P
z
ISW radiosounding that found a nearly neutral layer
200 m deep. In this layer, the wind clearly turns counter-
where the subscript P indicates that the derivatives are
clockwise with height, as Figure 21 suggests it should in
along surfaces of constant pressure. If these terms are
the Southern Hemisphere. But since the upper-level wind
not zero, meteorologists say that there is a thermal wind
components have different magnitudes, the turning
angle is not the 45 predicted for an Ekman layer; it is
or geostrophic shear; oceanographers prefer to describe
actually closer to 30. Nevertheless, there are enough
this effect as baroclinicity. The terms are all equivalent
(Arya and Wyngaard 1975).
similarities between Figure 23 and the Ekman model--
For the terms in eq 135 to be nonzero, we see that a
the turning, the height over which the turning occurs--
horizontal temperature gradient must exist. In other
for us to see that the essence of the model must be cor-
words, a surface that is not horizontally homogeneous
rect. For an even better demonstration of the veracity of
in temperature will induce thermal wind effects. How
the Ekman solution, see McPhee and Martinson (1994).
do these effects manifest?
They observed a fairly well behaved Ekman spiral in
By integrating eq 135 from the surface to height z,
the oceanic boundary layer under the sea ice at ISW.
we get the following
z
g
ln T
THERMAL WIND
∫
Ug (z) = Ug (0) -
dz′
(136a)
f
y
Many phenomena are present in the atmosphere that
0
void the assumptions on which Ekman based his model.
z
Thus, the paucity of observations of a true atmospheric
g
ln T
∫
Vg (z) = Vg (0) +
dz′
(136b)
Ekman layer is not surprising. The thermal wind is one
f
x
such phenomenon that complicates the analytical de-
0
scription of the ABL.
26


 Previous Page
