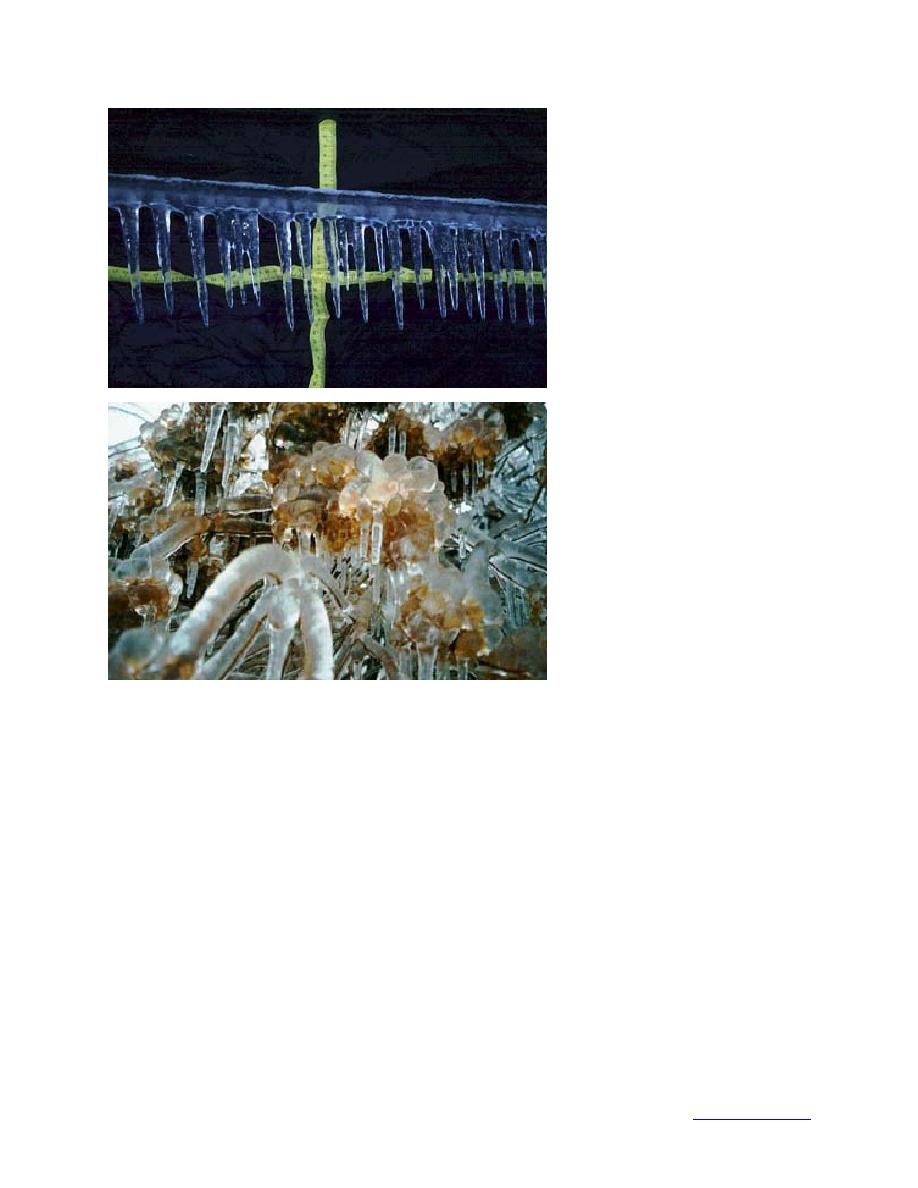
d. 0.7 in. at 1660 ft in Enfield, New
Hampshire, on January 12 (photo
Mulherin).
e. ~0.6 in. at 1300 ft in New Lon-
d o n during the storm (photo
Kathy Lowe-Bloch).
Figure 22 (cont'd).
Additional photos of accreted ice and our measured or estimated ice load, in terms of the
equivalent uniform ice thickness, are shown in Fig. 22 b through l. Fig. 22b shows a 0.2-in. ice
load in Swanton, Vermont, (100 ft) at 8:50 a.m. on January 8. We measured a 0.7-in. ice load
(Fig. 22c) near Rouses Point (110 ft) on the Vermont/New York border a half-hour later. The 0.7-
in. ice load in Fig. 22d was measured after the storm in Enfield, New Hampshire (1660 ft). The
photo in Fig. 22e was taken during the storm in New London (1300 ft). We have estimated an ice
load of about 0.6 in. from this photo and the branch diameters, assuming an almost round cross
section for the accreted ice. Other ice load estimates from similar photos taken in New London
during the storm range up to about 0.8 in. The ice in the photo in Fig. 22f remained on the trees
in a road cut near Ossipee (900 ft) three weeks after the storm. The measured load at that time
was 0.5 in., providing a lower bound for the load during the storm. We estimated the amount of
ice at a site between Vienna and Mount Vernon, Maine (500 ft), on January 8 from the photos in
Fig. 22g, calculating a load of 0.2 in. The photo in Fig. 22h of preserved ice on twigs at the same
location indicates a load between 0.3 and 0.4 in. Photos taken in Gray near the National Weather
Service office (400 ft) are shown in Fig. 22i and j. Estimates from the measured maximum ice
thickness and the observed cross-sectional shape (John Jensenius, NWS, personal communica-
34
Back to contents page


 Previous Page
