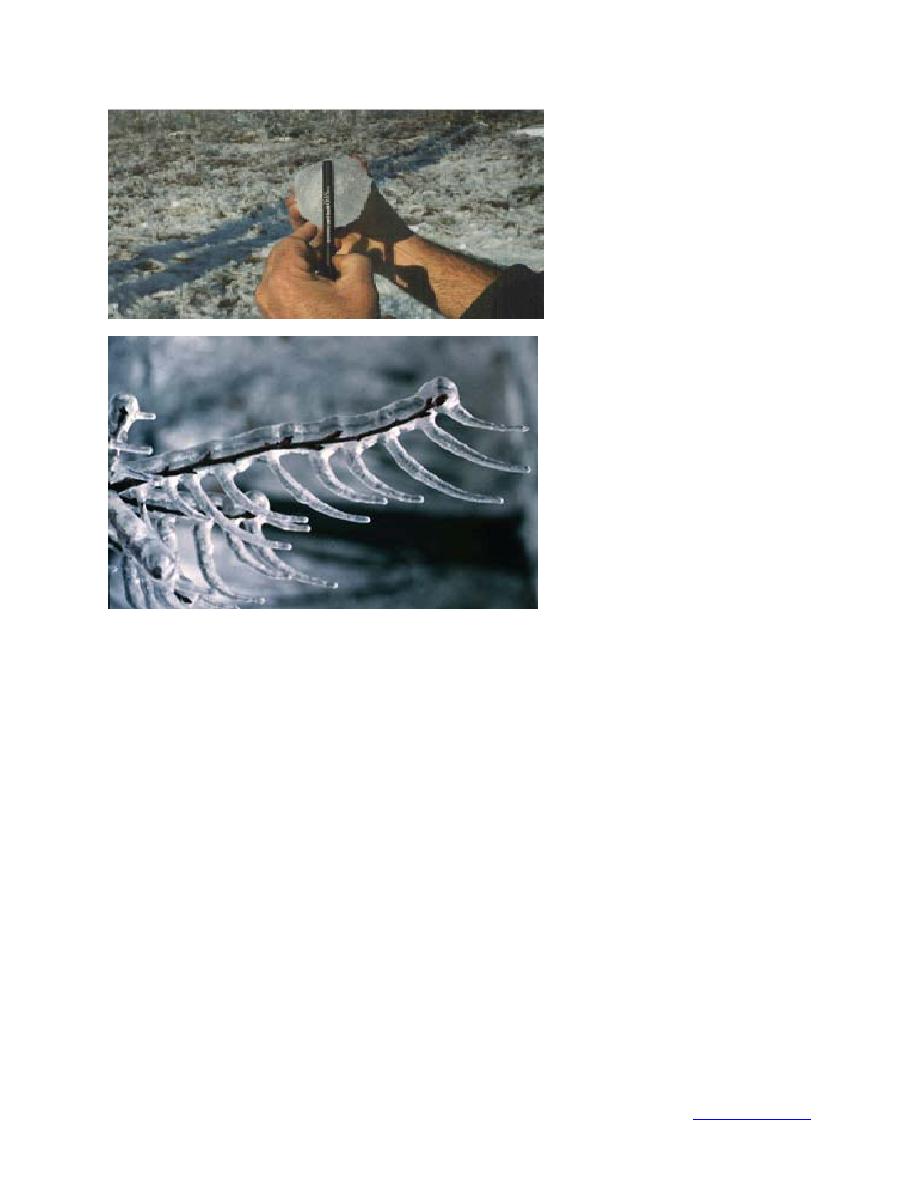
l. ~0.9 in. accreted on a conductor
at about 200 ft east of Deblois,
Maine (photo Larry Billings, Bangor
Hydro).
m. ~0.7 in. on a twig in Burlington,
Vermont (photo Gary Salmon, VD-
FPR).
Figure 22 (cont'd). Ice accretions with measured or estimated uniform ice thickness.
that cascaded was taken on January 11 east of Deblois, Maine. Using the scale in the photo we
estimated an ice load of 0.9 in. From a video taken at the site, we estimated a 1.1-in. ice load
from an accretion that was assumed to have fallen off the static wire. The photo in Fig. 22m of
ice on a twig was taken in Burlington, Vermont. Assuming a twig diameter of 0.25 in. (Gary
Salmon, personal communication) gives an equivalent uniform ice thickness of about 0.7 in.
6.3 Ice storm history
This severe ice storm is not unprecedented. Summary information on ice storms that have hit
the same region affected by the January storm is presented in Table 5. A map of each storm
showing the storm footprint and modeled ice loads and concurrent maximum wind speeds at
weather stations (for the storms after 1949) is included in Appendix A along with detailed infor-
mation on the damage caused by these storms, from Storm Data (NOAA 1959present), Clima-
tological Data (NOAA 1929 and 1942), journal articles, and newspapers.
7. EXTREME ICE LOADS
Design loads for long return periods and the return periods for extreme loads in severe storms
are determined from an extreme value analysis. The peaks-over-threshold method using super-
stations is described in the next two subsections. Extreme ice loads that we had determined for
this region prior to this storm, and new values estimated including our modeled ice loads from
37
Back to contents page


 Previous Page
