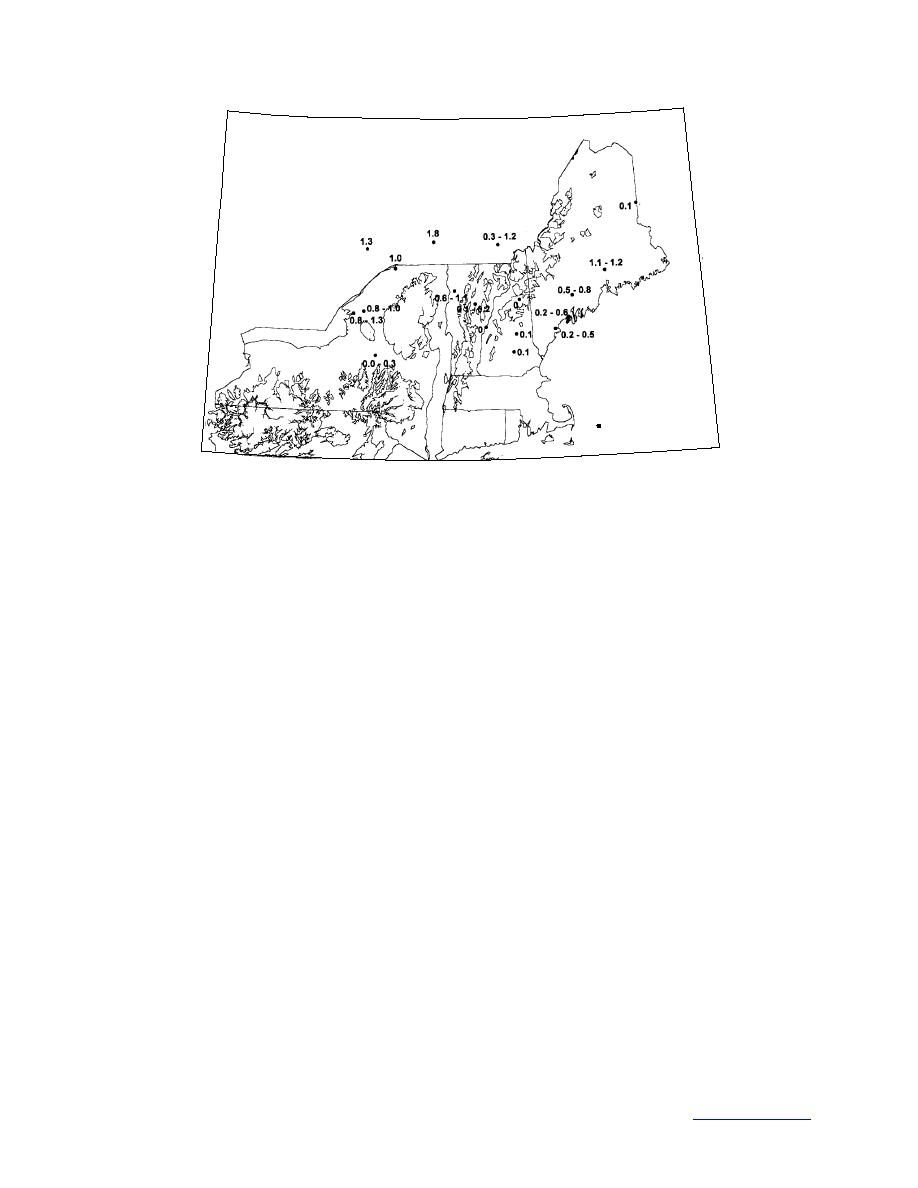
hourly weather stations
1500' contour shown
Figure 20. Ice loads at weather stations in the United States and Canada
in the January ice storm.
streets, phone wires still work when a tree is leaning on them, or even when they are on the
ground, as long as the wire is not broken.
6.2 Ice loads
We modeled ice loads in this storm using hourly weather data at stations in Canada, New
York, Vermont, New Hampshire, and Maine, using both the CRREL model and the simple mod-
el. Our results are shown in Fig. 20. Where a range of ice loads is shown, the lower load is from
the CRREL model and the higher load is from the more conservative simple model. A single
value indicates that the temperature was cold enough that the results from the two models are the
same. The 0.1-in. ice load in Laconia was measured by Russ Hobby at his weather station on a
3/4-in.-diameter horizontal rod. The AWOS weather station at the Laconia airport was out for
most of the storm, so the weather data we have included from Laconia is from Mr. Hobby's sta-
tion. In Montreal the weather data showed 1.4 in. of precipitation falling in a six-hour period in
the morning of January 10, with the present weather codes for those six hours indicating no pre-
cipitation and an air temperature of 36oF. In modeling the ice load there, we have assumed that
this precipitation actually occurred during the storm, but was not measured until the 10th when
the temperature went above freezing. We did not see apparently late-measured precipitation at
any other stations. The highest modeled loads are in Canada, particularly Montreal, and in up-
state New York. No freezing rain was observed at the summit of Mount Washington (6200 ft) or
near the Connecticut River in Hanover, New Hampshire (500 ft), where there was plenty of rain,
but the temperature was above freezing. In Houlton, Maine, on the other hand, the cold air layer
was too thick and cold for freezing rain and most of the precipitation fell as ice pellets. The map
in Fig. 21 shows the amount of precipitation at each site between January 5th and 10th, again in-
cluding the late measurement of 1.4 in. of precipitation in Montreal. There was less precipitation
in the southeastern portion of this region during the ice storm than elsewhere in the region.
30
Back to contents page


 Previous Page
