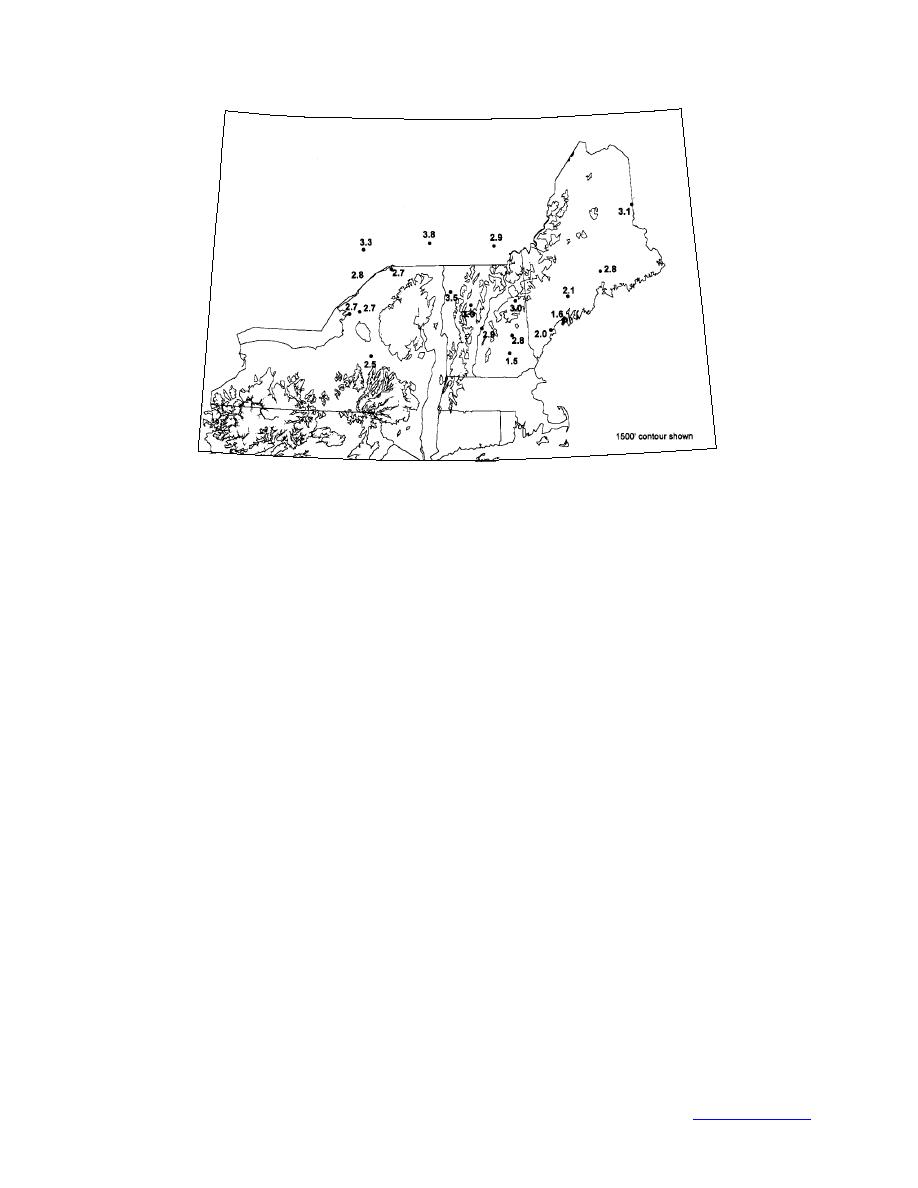
Figure 21. Total precipitation at weather stations in the United States and
Canada between January 5 and 10.
As freezing rain often occurs with temperatures very near freezing, the geographical distribu-
tion of icing may be associated with elevation in hilly or mountainous regions. Thus the ice loads
from the two weather stations in Vermont, the four in New Hampshire, and the five in the region
of interest in Maine cannot be easily extrapolated to the rest of those states. In this storm, in the
rough terrain in Vermont, New Hampshire, and Maine, it appeared that lower elevations were
generally too warm for the rain to freeze, while at higher elevations the air was colder. There
half-mile away and 600 feet higher, freezing rain falling at an air temperature of 31oF coated
trees and structures with ice.
To estimate the effect of elevation in the mountains on the accreted ice load, we used the
weather station data from stations in the region and decreased the air temperature in 1oF incre-
ments to simulate the temperature decrease that occurs with elevation increments of 280 ft in the
Standard Atmosphere (Batchelor 1962). We do not attempt to include in this simulation the prob-
ably higher winds at higher elevations, because the wind speed is affected by topography, as well
as by elevation. As the flux of precipitation increases with wind speed, windy sites that are also
cold enough will experience more severe ice loads than sites where the winds are light. The con-
servative simple model results in Table 4 show the possible effect of ice load on elevation in the
mountains of Vermont, New Hampshire and southern Maine. In eastern Maine and the northwest
corner of Vermont around Lake Champlain, the air temperature was cold enough at low eleva-
tions to freeze all the impinging precipitation.
We can compare these rough estimates of the
effect of elevation on ice load with a few measured loads. In Enfield, New Hampshire, at 1660
ft, 10 miles southeast of Hanover, we measured ice loads ranging from 0.4 to 0.7 in., less than
the 1 in. shown in the table at that elevation. At Gray, Maine, ice loads estimated from photos
taken by John Jensenius ranged from 0.7 to 1.0 in., more than the 0.5 in. expected at that eleva-
31
Back to contents page


 Previous Page
