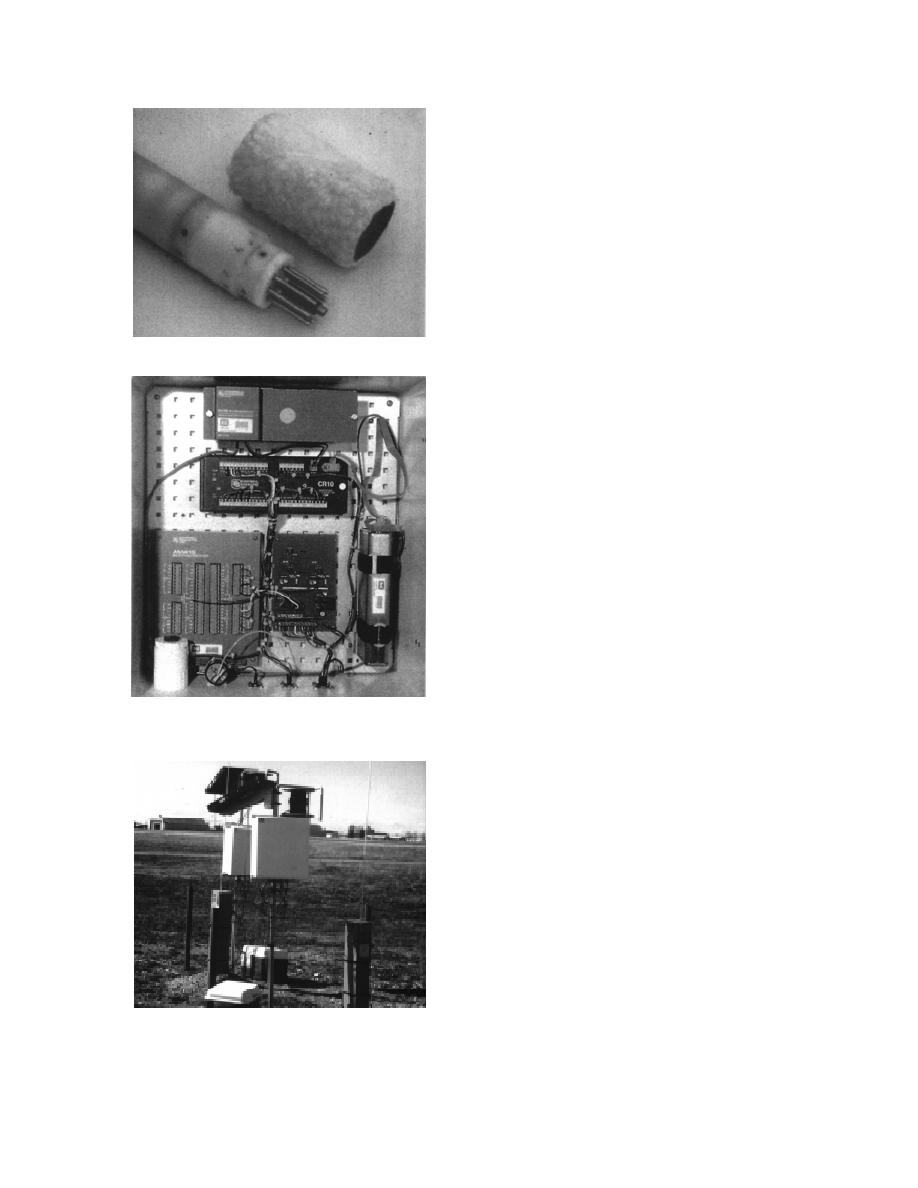
Campbell SM 716XT storage module and periodi-
cally downloaded to a portable computer for
analysis and graphical display.
ANALYSIS AND INTERPRETATION
Subsurface geology and
permafrost distribution
We defined the subsurface geology and perma-
frost distribution using GPR data from multiple
transects for which we obtained ground truth
using borehole logs from sites on each transect.
These data were augmented by landform analy-
ses using historical (1949) and recent (1993) aerial
a. Sensor.
photography of the site. Our interpretations of
the subsurface geology from borehole and GPR
data were thus linked to the surface morphology,
so that the spatial distribution of permafrost and
aquifers could be defined.
GPR data
GPR profiles of the landfill were generally
unable to reveal the nature of the subsurface,
despite our using low-frequency (50-MHz) an-
tennas. The signals were extremely attenuated,
penetrating to only 1 to 2 m depth. This probably
resulted because fine-grained coal ash from the
Fort Wainwright power plant is buried in the land-
fill.
Therefore, we investigated the area surround-
ing the landfill, so that stratigraphic and ground
water data could be extrapolated to evaluate the
state of the materials below it. The 1949 aerial
photograph of the site (Fig. 4), taken before the
b. Control unit with Campbell CR10a datalogger
landfill was built, shows a surface similar to the
installed at field site.
surrounding terrain beneath it. Assuming that the
stratigraphy is similar to that of the surrounding
area, we can infer the subsurface conditions be-
neath the landfill.
Radar reflections in the north-central canton-
ment area result mainly from changes in material
type, such as from coarse to fine-grained deposits
or from sedimentary units to bedrock, and from
changes in water or ice content (Arcone et al., in
press). Abrupt changes in the time delay of reflec-
tions in frozen sediments may indicate strati-
graphic changes in grain size or the unfrozen
water content. There is generally little attenua-
tion where permafrost is very close to the surface.
In this case, the signal can penetrate deep into the
permafrost, to greater than 80 m below the ground
c. Typical field installation with solar panels and
surface. In contrast, signals are strongly attenu-
12-V battery for power at remote site.
ated in thawed or perennially unfrozen sediments.
Figure 9. Automated ground water flow system.
The 50-MHz profiles described here were
9


 Previous Page
