signals centered near 50, 100, and 300 MHz. We
Monitoring wells
profiled each transect by towing the antennas
Monitoring wells, generally in clusters of three
along the ground approximately 610 m behind a
at depths of about 10, 20, and 30 m, were drilled,
tracked vehicle moving at a constant velocity of
logged, and developed for use with the CRREL
about 1 m/s. Event markers were placed artifi-
ground water flow system (Fig. 8) (see following
cially on the records at 10-m intervals. Single trace
section). Monitoring well clusters are located in
time durations of 150, 600, and 1500 ns were
thawed zones above the permafrost or in unfro-
commonly used for the 300-, 100-, and 50-MHz
zen zones laterally confined by it. Additional wells
were drilled through the permafrost into the
antennas respectively. For a more complete
subpermafrost aquifer; these wells were pressur-
description of the GPR methods and theory, see
ized to keep ice growth from closing them. We
Appendix A of Lawson et al. (1996).
used data from GPR surveys and borehole logs,
GPR is reflected and diffracted at material inter-
and geomorphic features and other geological
faces, with a signal amplitude strength deter-
data, to select monitoring well locations that
mined by the contrast in relative dielectric per-
would provide representative ground water flow
mittivity e across the interface. The thickness d of
data.
a layer was interpreted using the echo delay for-
mula for normal incidence
Monitoring wells above and below the perma-
frost were built following standard procedures.
d = ct2/e
(1)
Each monitoring well was drilled to a specified
where c is the free space speed of light (3 108
depth, where a 3-m-long well screen was installed.
m/s), t is time, and the factor of two accounts for
The well screens, of about 5 cm (2 in.) i.d., are
the round trip propagation path. Typically, the
made of continuous wire wrap stainless steel, with
value of e for permafrost is about 5, and ranges
a 15-mm- (0.060-in.-) slot size and a filter sock of
between about 10 and 45 for unfrozen sediments
120- to 150-mm mesh covering the outside. Labo-
of varying degrees of saturation and grain size.
ratory testing at CRREL shows that this configu-
An outcrop of the local bedrock was measured at
ration minimally restricts water movement, while
e = 11 using a wide angle sounding technique.
stopping finer sediments from infiltrating the well
Arcone et al. (in press) provide de-
tails of the analysis and interpreta-
tion of permafrost and aquifers
from GPR profiles.
We determined subsurface mate-
rial types and permafrost horizons
by drilling test boreholes in 1993
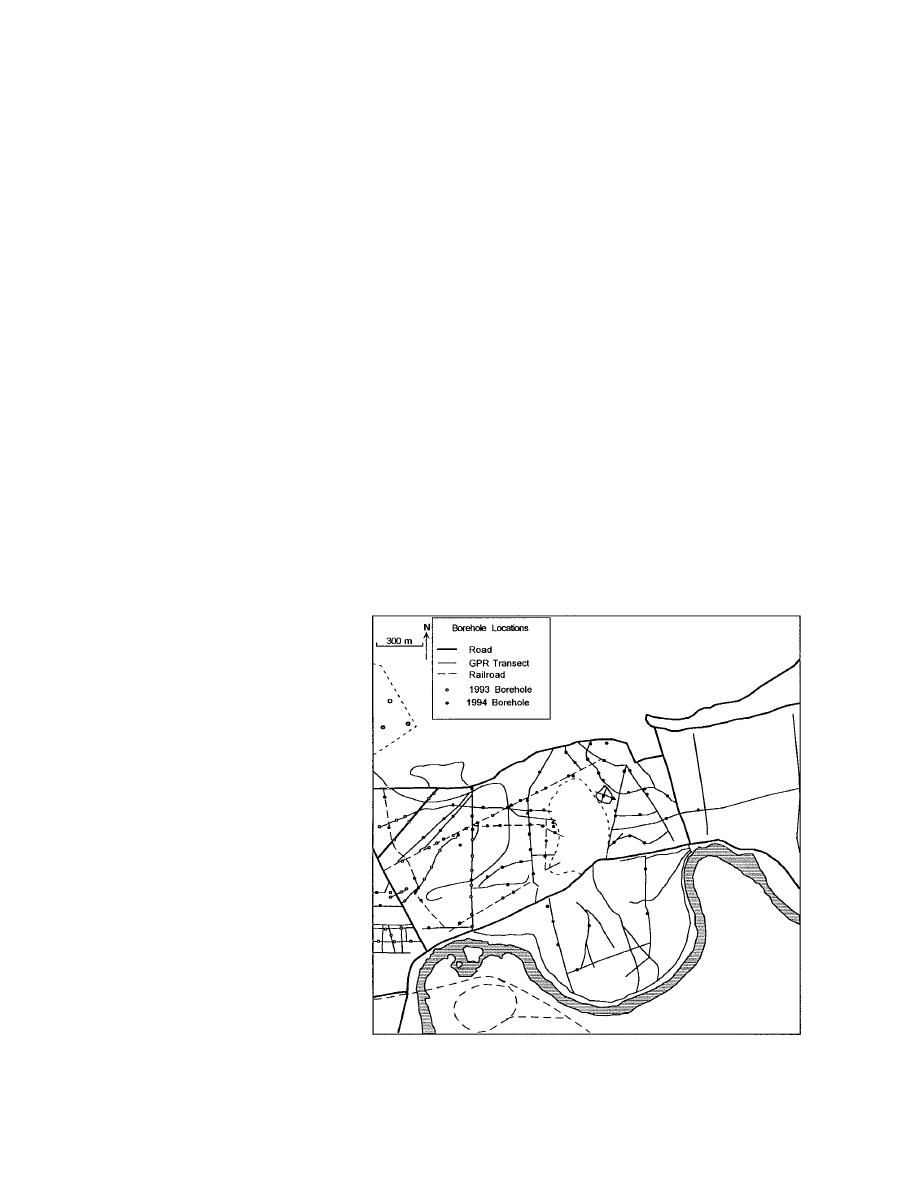
and 1994. Drill sites (Fig. 7) were
chosen using preliminary inter-
pretations of the site's geomorphic
features and any available GPR
data. We subsequently combined
borehole and GPR records to make
interpretive cross sections of per-
mafrost and aquifer distribution.
Data on the thickness of active lay-
ers (less than 1.5 m thick) were also
obtained by probing with a hand-
driven steel rod. We measured
p i e z o m e t r i c surfaces in wells
installed in the suprapermafrost,
subpermafrost, and unfrozen zone
aquifers. Geological logging of
Figure 7. Locations of boreholes used to interpret GPR data in the north-
each borehole followed standard
central cantonment area.
procedures.
7


 Previous Page
