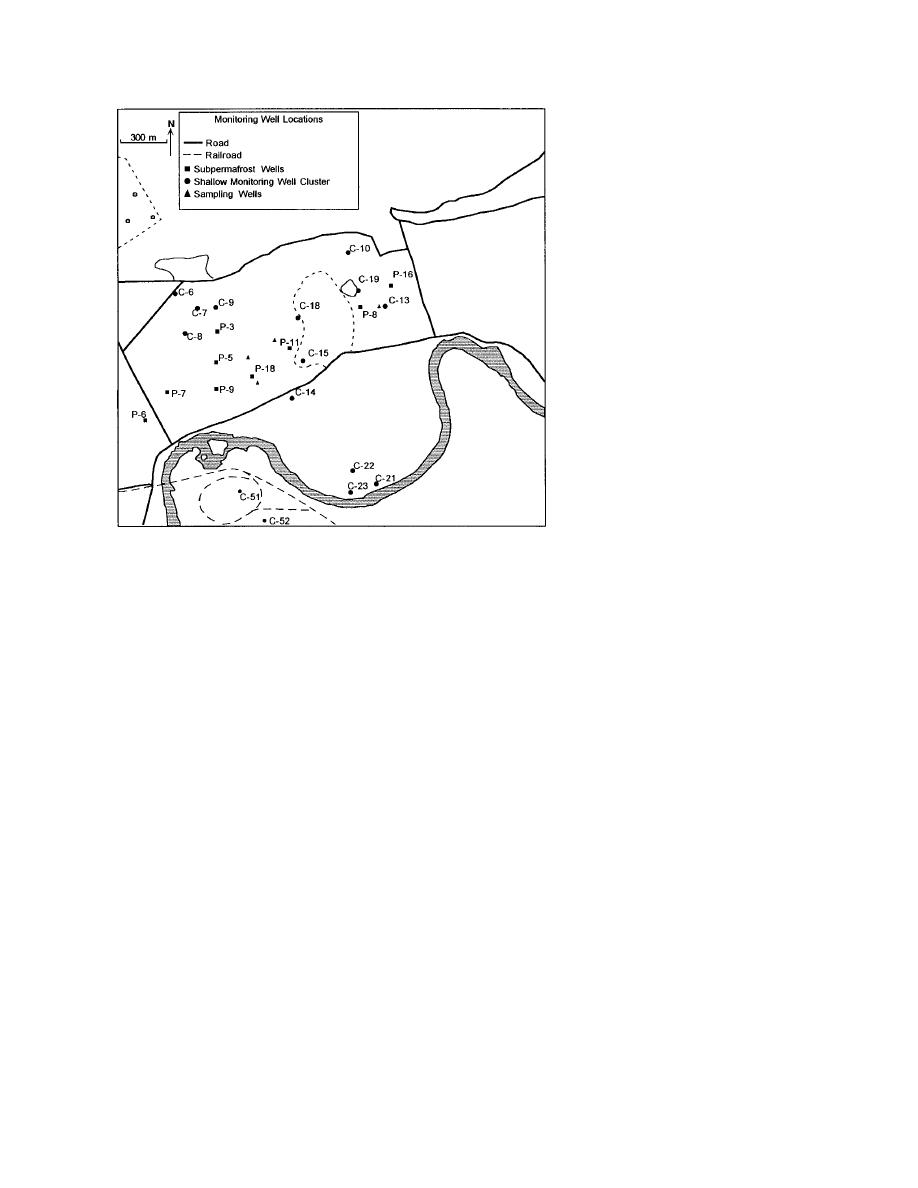
Figure 8. Monitoring wells in which
the CRREL ground water flow system
is installed.
screened interval of the monitoring wells. This
and affecting measurements. During installation,
material consisted of a commercially available
each hole was allowed to collapse around the
sand mixture (sieve no. 812), compacted to a
filter-covered screen as a way to minimize the
porosity similar to most materials in the well
well's effect on ground water movement. Moni-
screen intervals. A constant displacement pump
toring wells set in the subpermafrost aquifer were
was used to regulate seepage rates in the flume
screened at a depth beginning 3 m below the per-
from 1 to 10 ft/day (0.3 to 3 m/day). An empirical
mafrost. Water levels were recorded in sub-
linear relationship between sensor readings and
permafrost wells after they were completed.
seepage rates was determined for each system for
a known direction of flow. The accuracy of the
Ground water flow system
flow system is 0.1 ft/day (0.03 m/day) over the
CRREL's prototype ground water flow system
range of 0.5 to more than 10 ft/day (0.15 to more
uses the thermal tag and trace technique (e.g.,
than 3 m/day). Direction, as defined by ten mea-
Chapman and Robinson 1962, Hess 1982) to mea-
surements in the flume, is accurate to within 5.
sure flow direction and seepage velocity. The
Details of the calibration procedure are given in
system uses a sensor with four pairs of platinum
Williams et al. (in prep).
resistive temperature devices (RTDs) in steel tynes
Seepage direction and velocity are measured
arrayed in a circular pattern around a point source
four times per day in summer and twice per day
heater (Fig. 9a). Heat is transferred preferentially
in winter, with system functions controlled by a
by ground water flow from the heater to the RTDs.
Campbell CR10XT datalogger (Fig. 9b). Signals
Conductive heat transfer is enhanced by glass
are transmitted by cable from the flow sensor,
beads placed into the screen in which the RTD
which is held by steel rods and a clamp at a speci-
tynes are imbedded. Temperature fluctuations
fied depth. Power is provided by an external 12-
between paired RTDs, relative to background
V, deep cycle battery, charged by a solar panel
levels, are recorded. This temperature differential
mounted on a pole with the control unit (Fig.
is then used to calculate the direction of flow and
9c). A pressure transducer (Druck PDCR-35D)
seepage velocity.
installed in each well records water level (piezo-
Each sensor was calibrated individually in a
metric surface) fluctuations at the same time as
section of well screen set in a flume filled with
flow measurements. Data are stored using a
materials generally representative of those in the
8


 Previous Page
