2
3
GSD
Lapse
2
1
Interrupt
∆T
Line
1
0
P (h)
k
m
nO
u
2
3
Inversion
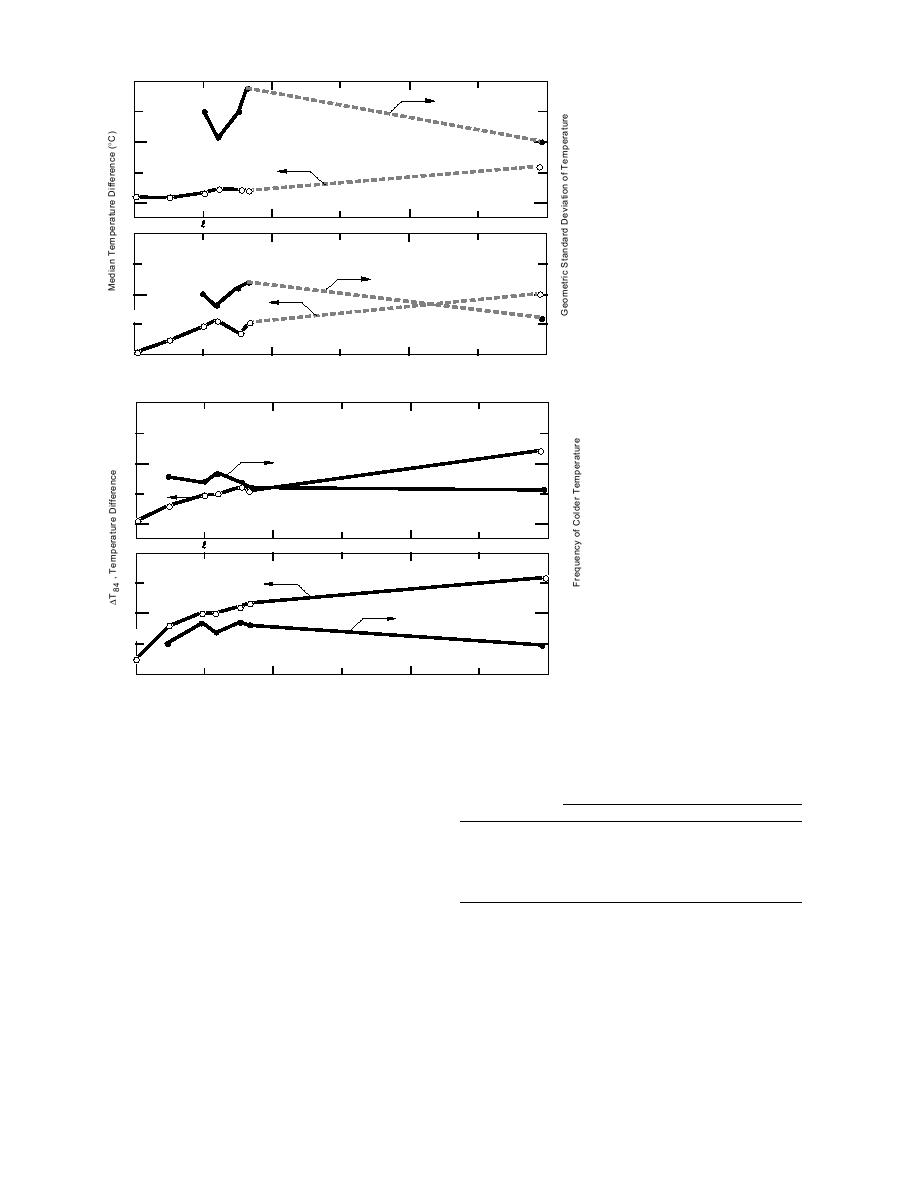
Figure 7. Median temperature dif-
GSD
Interrupt
ference and the geometric standard
Line
2
1
deviation of temperature difference
∆T
P
measured along the river under
lapse and inversion conditions. The
1
letters coordinate the location of
0
10
20
30
observing points with Figure 3.
Distance Along Chord from P
2
1.0
Lapse
Frequency
1
0.5
∆T84
0
0
h
m
P (h)
k
nO
u
2
1.0
Inversion
∆T84
0.5
1
Frequency
P
Figure 8. Eighty-fourth percentile
of temperature difference, and the
0
frequency of colder air tempera-
0
10
20
30
ture than at P, the reference point.
Distance Along Chord from P
Table 7. Trend of temperature difference relative to
The data were initially stratified by both snow
snow cover.
depth category and temperature structure to per-
form the analyses shown in Tables 4, 5, and 6.
Frequency of >0.4C temperature difference
Distance
This stratification was deleted to simplify the pre-
Symbol
(km)
<10 cm snow >10 cm snow >30 cm (3 cases)
sentations in those tables. The frequency of tem-
perature difference greater than 0.4C at three
h
0.1
0.06
0.13
All
points along the river at less than and greater
k
2.6
0.22
0.31
All
than the 10 cm snow cover which Baker et al.
(1992) considered necessary to mask underlying
l
5.9
0.40
0.61
All
surfaces are listed in Table 7. Lapse and inversion
data are combined in Table 7, and the tempera-
ture difference at the point 30 km south of bridge
DISCUSSION
P, exceeds 0.4C three-fourths of the time, with all
snow conditions. There is a systematic increase in
The NOAA and AES climatic records show
the frequency of greater temperature difference
that relatively great differences in the frequency
of subzero (17.8C) air temperatures occur over
when more than 10 cm of snow cover is present at
the points along the river.
small horizontal distances in many places in the
11


 Previous Page
