The observations obtained for the analysis of
5
local temperature differences were obtained in
conjunction with other research being conducted
0
in this area but no meteorological preselection
occurred. The observer was not present in the
study area on many days each winter. The statis-
5
tical analyses that follow are based on 158 De-
cember, January, and February days during the
period December 1990 through February 1993.
10
All observations were made prior to local sunrise.
It was not always possible to complete both an
15
eastwest and northsouth transect on some days
prior to sunrise, limiting the data set to 100120
days for some comparisons. No days have been
20
deleted from the data set. Rain or freezing rain
truncated data collection on some days, and one
observation attempt is incomplete due to inacces-
25
20
15
10
5
0
5
sibility of point A due to blowing snow. Data
Piermont Bridge (P)
from other periods during the winters 19881994,
Air Temperature (C)
obtained with the same techniques, are used to
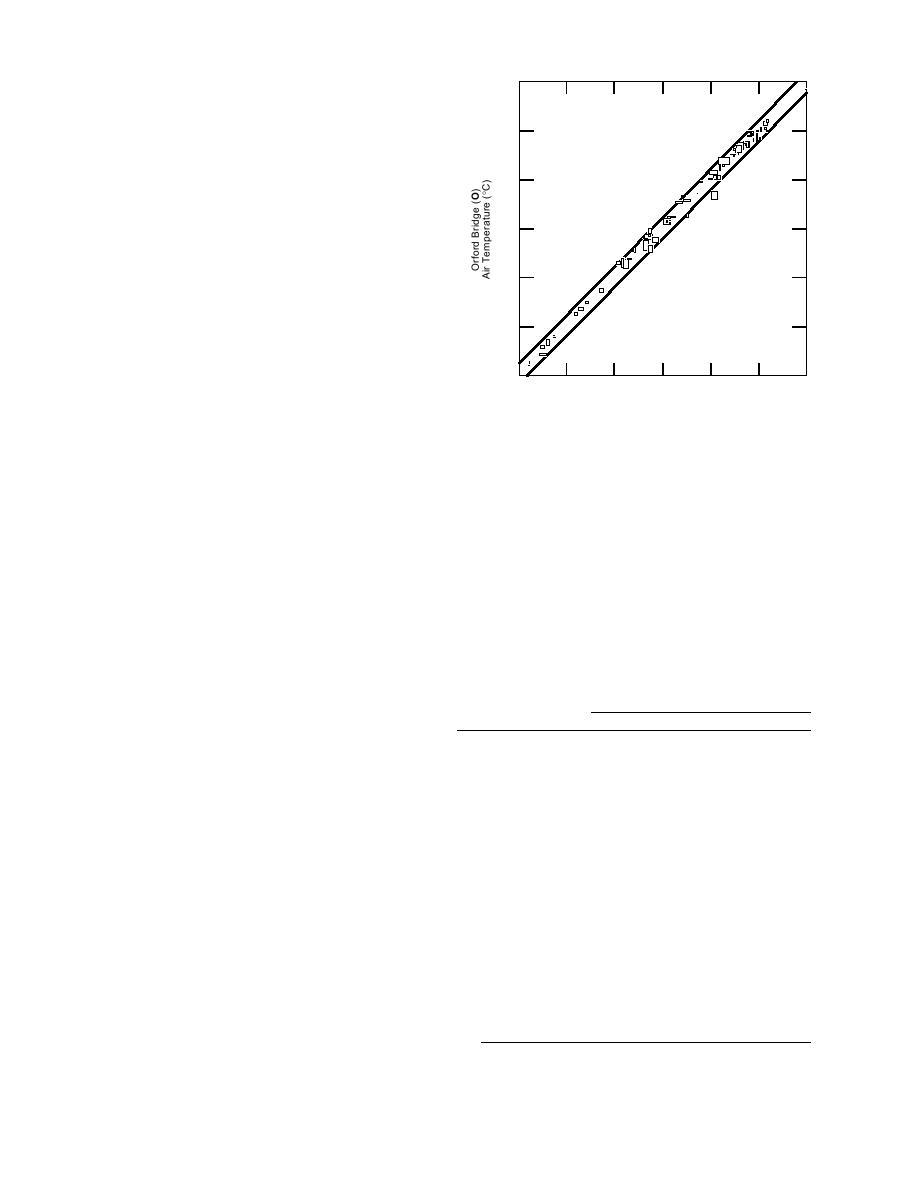
Figure 6. Temperature differences measured on two
illustrate some specific cases.
bridges 9 km apart along the Connecticut River. The
plotted boxes enclose the range of temperatures observed
on each bridge.
EVALUATION OF THE
CONNECTICUT RIVER SURFACE AS
A TEMPERATURE REFERENCE PLANE
ditions approximated that of the entire (199093)
We propose that the air over a still river can be
experiment period. The data are tabulated in Table
used as a reference plane for comparison of other
3, which indicates that an absolute difference of
air temperatures. The air temperatures above the
(1C) in air temperature was exceeded only once
river, and along a plane coincident with the river
bank, need to be examined to determine the con-
tiguity of this surface as a temperature reference.
A preliminary examination of the variation in Table 3. Temperature differences among three bridges.
temperature on two bridges, located 9 km apart
Temperature difference (C) (absolute value)
Snow depth (cm)
at P and O in Figure 3, was made by Hogan and
(temperature structure)
O, P
P, H
O, H
Ferrick (1991). Figure 6, adapted from that work,
compares the range of temperatures observed each
<3 (Lapse)
0.2
0.0
0.2
morning on the OrfordFairlee (O) bridge to the
<10 (Lapse)
0.1
0.1
0.2
range of temperatures measured on the Piermont
0.5
1.3
0.8
Bradford (P) bridge a few minutes earlier each
day. The temperature difference exceeded 1C on
<30 (Lapse)
0.1
0.5
0.4
0.7
0.3
1.0
only 3 of 62 days of observations. On most days,
0.4
0.4
0.0
the variation along the length of a bridge, or the
variation among replicate observations, equaled
<3 (Inversion)
0.5
0.0
0.5
or exceeded the temperature difference between
2.3
0.3
2.6
the two bridges.
0.5
0.0
0.5
An additional bridge lies 10 km north of the
<10 (Inversion)
1.8
0.6
1.2
main experiment area, at H in Figure 3. A brief
0.3
0.1
0.2
series of experiments were conducted in January
and February 1992 to examine the temperature
<30 (Inversion)
0.8
1.0
0.2
differences along this 20 km of the river plane.
0.0
1.2
1.2
Observations were completed on 15 mornings and
0.5
0.3
0.2
0.8
1.0
0.2
the relative frequency of lapse and inversion con-
8


 Previous Page
