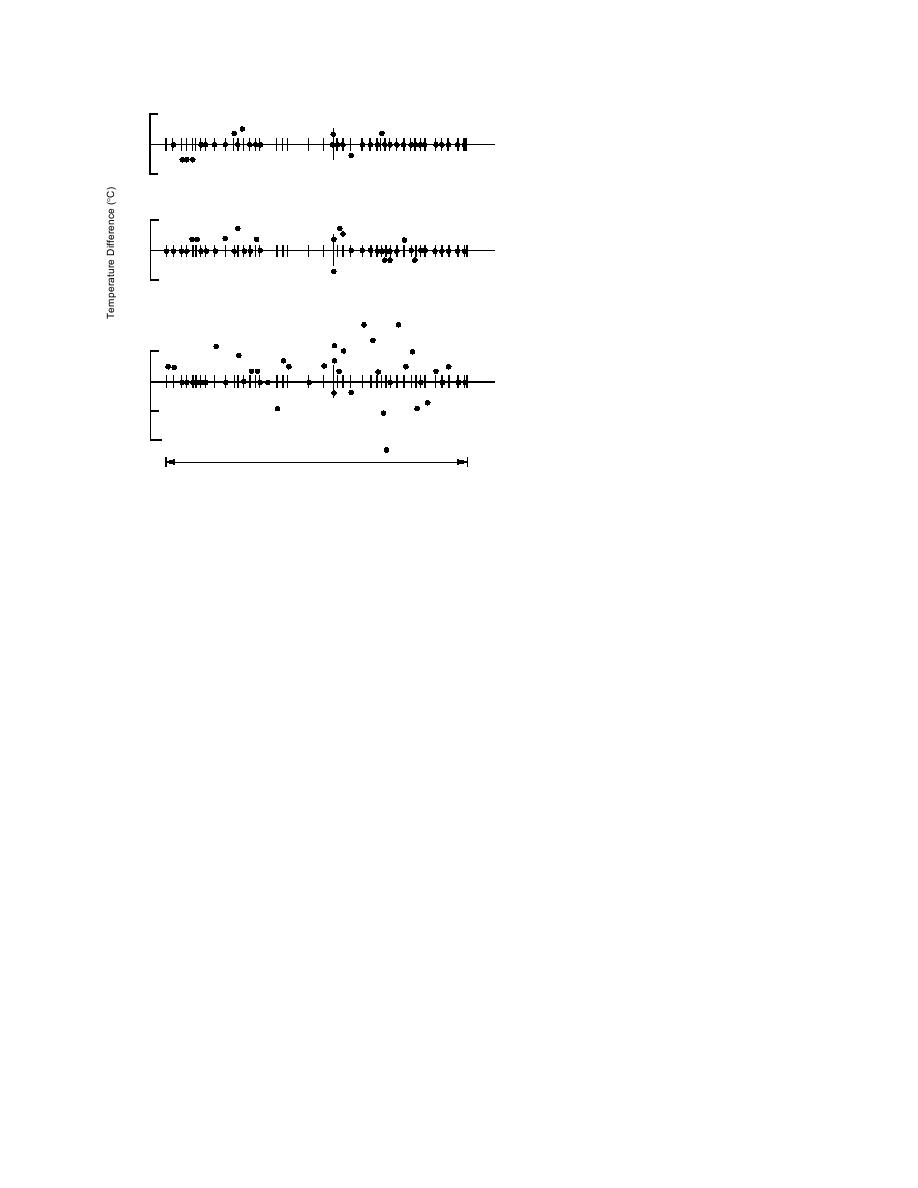
differing meteorological conditions, repre-
11 Jan '91
Calm-CsAs Overcast
senting those most frequent in the area,
Cold Advection
0.5
are given in Figure 5.
Lapse (but not necessarily adiabatic)
0
temperature structure is sometimes present
in the Connecticut River Valley when cold
0.5
8 Jan '91
advection occurs in winter. The upper two
Calm Clear
temperature difference plots in Figure 5
Cold Advection
0.5
show the difference between replicate tem-
perature measurements at individual
0
points, as described above, observed dur-
0.5
ing cold advection with apparent lapse
structure along the slope. Inversion is fre-
26 Jan '91
quently present in this valley when warmer
4/10 Cs
Warm Advection Aloft
air is advected over it in winter. The lower
0.5
plot in Figure 5 shows the temperature
differences from replicate measurements
0
under warm advection and apparent inver-
sion conditions. Lapse and inversion were
0.5
defined by WA temperature difference.
Precise (within the 0.1C resolution of
1.0
P
W
A
the digital display) replication of tempera-
8 km
ture observation was achieved in 56 of 77
Figure 5. Magnitude of difference of repetitive air temperature
instances under lapse and cold advection.
measurements (solid circles), accompanying a direction rever-
The maximum difference observed was
sal, over a 3- to 12-minute period. Observed differences of less
0.3C, and four observing points showed
than 0.1C are plotted along the zero axes.
temperature differences greater than 0.1C
on both occasions. This indicates that this
technique of temperature measurement does not
was brought to a halt on a deserted road while
induce apparent temperature variation of greater
noting the air temperature. The vehicle was then
than 0.1C. However, position, sampling, and tem-
promptly reversed through its exhaust plume, and
poral temperature differences of as much as 0.3C
the temperature again noted. Temperature in-
creases of 0.5 to 1.5C could be achieved in this
may occur in the observed data.
Precise (0.1C) replication of temperature ob-
way. This was easily avoided by maintaining a
served was only achieved in 16 of 44 instances
distance of 100 m from the infrequent vehicles
under inversion conditions. Differences exceed-
encountered along the path of observations. Any
ing 1.0C were observed, and differences of 0.3 to
temperature increase due to this modification ne-
0.5C were common between replicate observa-
cessitated by closer proximity to vehicles while
tions. These differences are attributable to the time
passing through populated areas is considered as
response of the temperature sensor, and the re-
part of the "heat island" modification.
versal of the sign of the rate of change of tempera-
Additional experiments were conducted to ex-
ture when penetrating inversions. Subsequent
amine the "sampling error" or "position error" of
sections will show these differences in measure-
the observations. These experimental observations
ment precision are tolerable when compared to
were conducted by first making observations at
the temperature differences in the vicinity of these
several points along the 8-km transect noted by
inversions. More realistically, the sensor probe
PWA in Figure 3, and then repeating the obser-
advances at about 12 m/s along a 10% (100 m/
vations in reverse order. This reversal altered the
km) grade. The distance response of Table 2 shows
path followed by the probe and its proximity to
the sensor responds to 0.95 of an temperature
banks and barriers along the course. It also re-
change in 150 m, which is 15 m of elevation change
versed the sign of the rate of temperature change
along the slope. A one-way penetration can then
when penetrating inversions. The elapsed time
detect inversions of 15-m thickness; a replicate
between repetitive measurements at individual
penetration can determine the temperature at this
points was a minimum of 3 and a maximum of 12
inversion within 1C.
minutes. The results obtained on three days with
7


 Previous Page
