2.4
calculated conditions. From eq 118b and
Cr
119, it can be seen that, if θ = 1.0, there is
1
3
no consideration of previous values of
2.2
5
10
the variables or their derivatives in the
12
solution for their values at the new time
2.0
24
step (except in the time derivative).
Cunge et al. (1980) show that while the
1.8
Preissmann scheme becomes second-
order accurate under the special case of
1.6
0
1000
2000
3000
4000
5000
θ = 0.5, it also becomes dispersive due to
x Location (m)
the finite difference approximation of
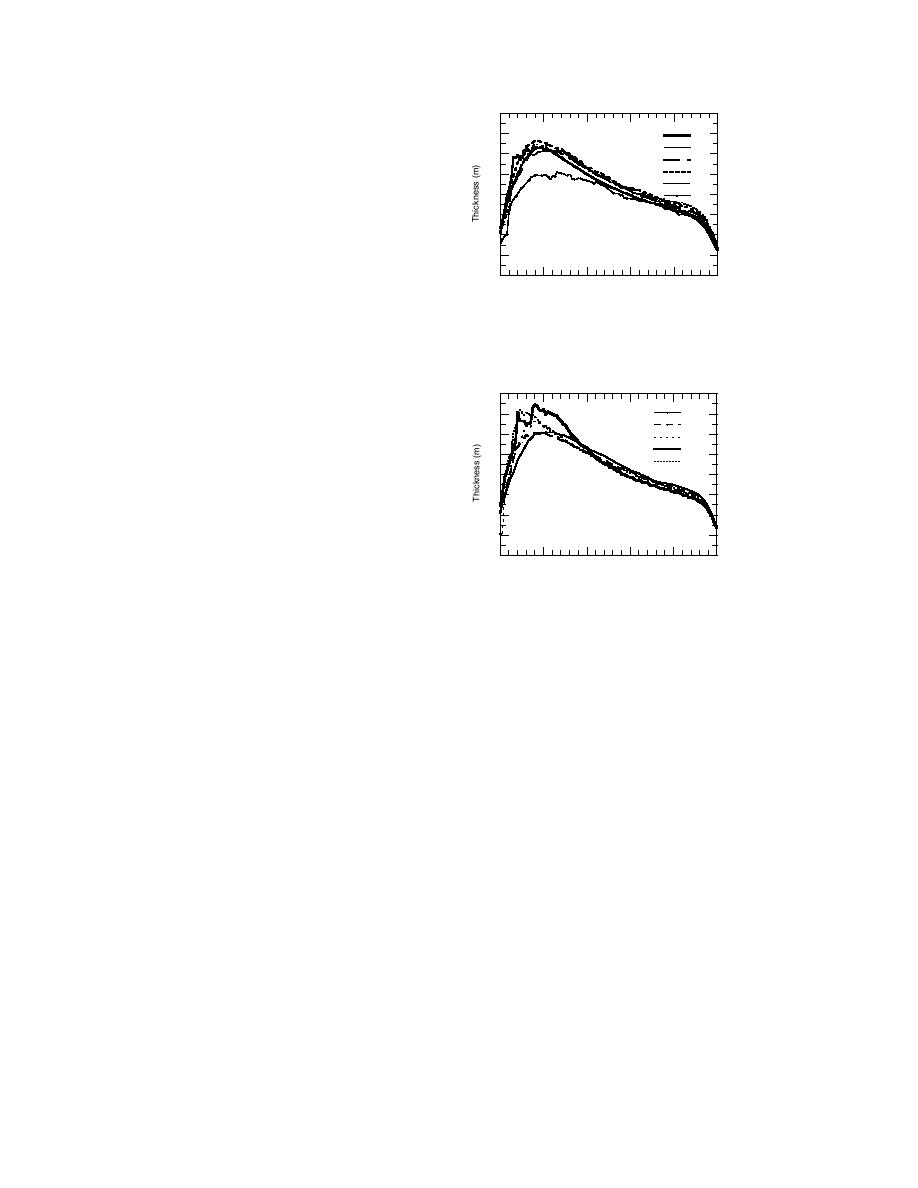
Figure 43. Final jam thickness profiles for
some of the higher order terms. For open-
Courant numbers of 1, 3, 5, 10, 12, and
water simulations, the dispersion results
24.
in a wavy surface with relatively high-
frequency oscillations. By specifying
2.4
0.5 < θ ≤ 1.0, the solution becomes diffu-
0.55
0.60
sive, smoothing out the high-frequency
2.2
0.66
oscillations and providing a more realis-
1.00
0.80
tic solution. The ideal solution would be
2.0
one in which dispersion and diffusion are
both minimal.
1.8
A separate weighting factor θi was
specified for the ice. The movement of
1.6
the ice can be quite different from that of
0
1000
2000
3000
4000
5000
x Location (m)
the water because it can start and stop
rather suddenly. The effects of using the Figure 44. Final jam thickness profiles for θi
current values of ice velocity to calculate = 1.0 and θ = 0.55, 0.6, 0.66, 0.8, and 1.0.
the new values were unknown. For ex-
ample, if the ice cover was in motion and the new stability check showed that it
should be stable (the new ice velocity, υ = 0), the previous value of ice velocity may
have an undesirable effect on the newly calculated ice thickness if θi < 1.0. Detailed
inspection of the calculated ice velocities (as ice begins moving and as it slows to a
stop), however, showed that absolute changes in ice velocity over a time step were
not large and, thus, the θi-weighted average of ice velocity would provide a proper
solution.
The effects of the water-weighting factor on the solution were investigated by
running the baseline conditions at a variety of θ values for θi = 1.0. Values of θ
tested included 0.5, 0.55, 0.6, 0.66, 0.8, and 1.0. The simulation with θ = 0.5 resulted
in unacceptable oscillations in the water depth and velocity, which, because the
solution is fully coupled, resulted in large oscillations in ice velocity and thickness.
The oscillations in the water variables aggravated the oscillations in the ice vari-
ables and the solution became highly unstable. For instance, the depth would
decrease with an accompanying water velocity increase that increased ice velocity
and thickening, thereby further reducing flow depth. Figure 44 shows the final jam
thickness profile for θ = 0.55, 0.6, 0.66, 0.8, and 1.0. While θ = 0.55 shows a smooth
final profile, it resulted in highly variable water depths, especially at the initial
increase in upstream water discharge. A value of θ = 0.6 provided the most accept-
able solution in terms of both water depth and ice thickness throughout the simu-
lation period.
63


 Previous Page
