8
where greater than the equilibrium jam
thickness calculated using eq 25.
Initial WSL
6
Courant number sensitivity
Final WSL
Many calculation schemes are sensi-
4
Initial Ice Bottom
tive to the computational time and space
intervals (∆t, ∆x) used. The sensitivities
2
Final Ice Bottom
for hyperbolic problems are usually dis-
Bed
cussed in terms of the Courant number
0
0
1000
2000
3000
4000
5000
x Location (m)
∆t u + c
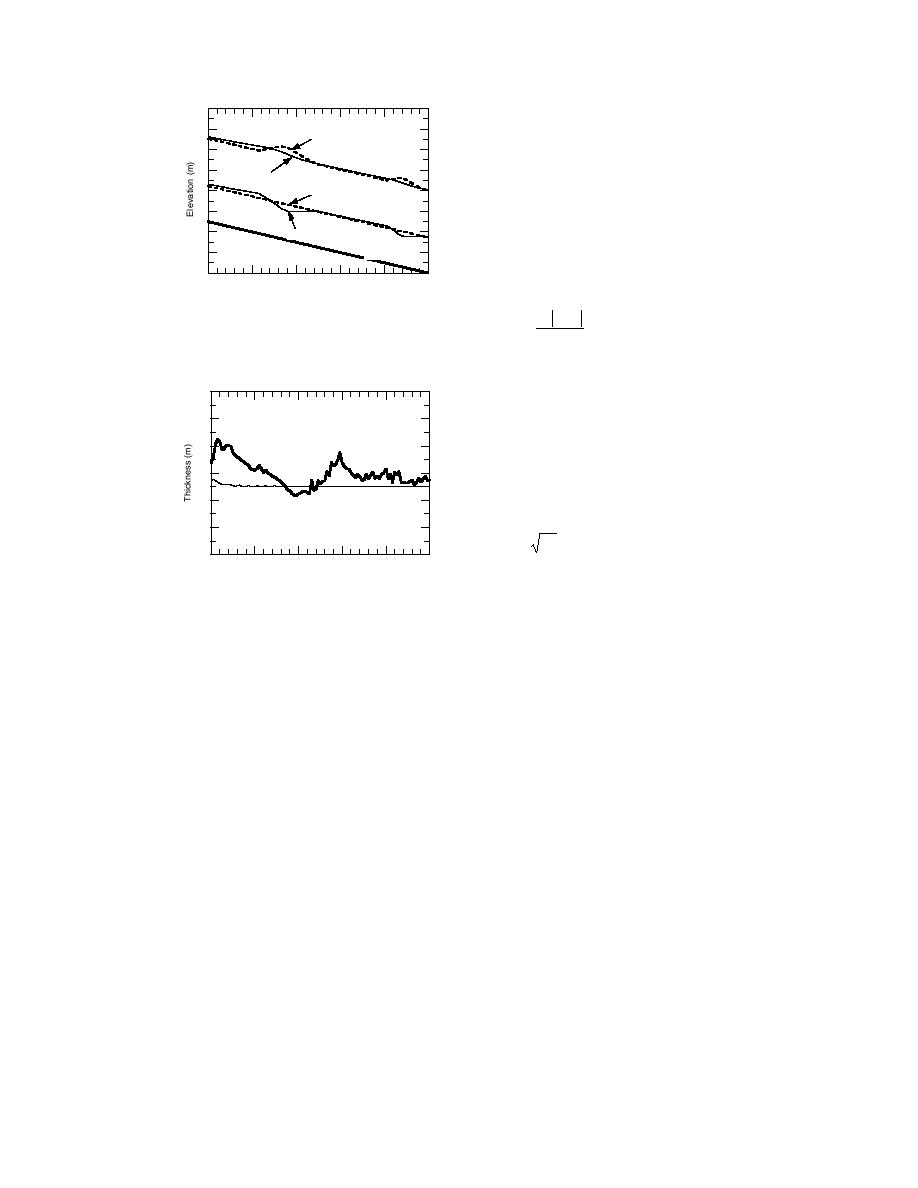
Figure 41. Initial and final water surface
Cr =
(151)
∆x
level and bottom of ice profiles for an ice
jam having nonuniform thickness.
where c is the gravity wave speed
through the fluid. Because of the as-
1.8
sumption that ice floats on water and is
free to move up and down in the verti-
cal direction in accordance with the dic-
1.6
1.3 m Initial
tates of buoyancy, gravity wave speed
beneath a jam would be equivalent to
1.45 m Initial
1.4
that of open water, i.e.
c = gd .
(152)
1.2
0
1000
2000
3000
4000
5000
x Location (m)
The Courant number expresses the
Figure 42. Final jam thickness profiles for
ratio of the distance traveled by a dis-
two initially unstable jam thicknesses.
turbance in one time step to the length
of a computational distance step. For the
simplest Method of Characteristics, the Courant number must be less than or equal
to unity so as to ensure that the solution remains within the computational do-
main. Implicit finite difference methods, as well as interpolated-grid Methods of
Characteristics, relax this requirement somewhat. Care must be taken, however, to
make sure that disturbances do not travel too far over a time step, thereby resulting
in loss of resolution or too much smoothing. For a given computational length step,
larger Courant numbers imply larger time steps and less total computation time,
with concomitant loss of temporal resolution.
Equations 151 and 152, applied to the baseline parameters in Table 1 and the
initial conditions for depth and water velocity, yield Cr = 2.82. By calling this value
nominally Cr = 3, runs were then made with Cr = 1, 5, 10, 12, and 24. The Courant
number was varied in these tests by adjusting the time step and leaving the length
step at 50 m. The boundary conditions file was modified, however, to retain the
same shape and timing of the inflow hydrograph. Figure 43 shows the final jam
thickness profile for the runs with Cr = 1, 3 (standard), 5, 10, 12, and 24. The plot
shows that there is little difference in results with Cr values up to 12, and that some
diffusion or smoothing is evident for Cr = 24.
Theta-weighting factor analysis
The theta-weighting factors for the water θ and for the ice θi are presented in the
Discretization of the System of Equations section and are used to describe the time
averaging between the known conditions at the current time step and the future,
62


 Previous Page
