Model rigor
An unsteady model should be able to operate in steady flow mode without prob-
lems. This requirement is demonstrated in the previous section, when steady flow
values were obtained for the initial conditions of the variables. A model should
also be robust, being able to compensate for initial conditions far from steady or
uniform. The model was tested under a variety of "bad input" conditions to see if
it could adjust to steady flow conditions.
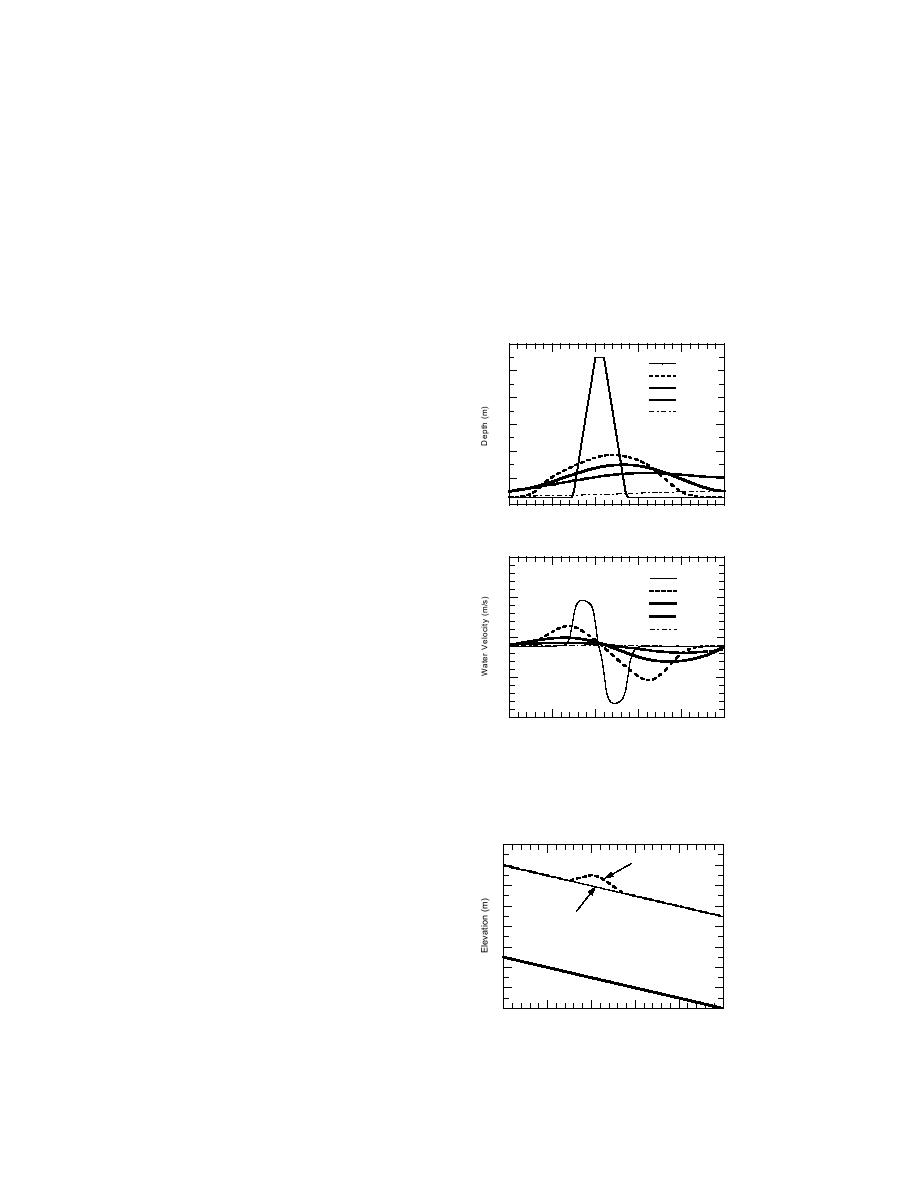
The first tests involved initial conditions that included either a significant depth
increase or decrease. The initial cover thickness was specified such that no thicken-
ing would take place. The objective was to see if the model could return to steady
conditions of depth and velocity (initial
baseline conditions) given these nonuni-
2.3
form initial conditions of depth. The up-
0 min
stream discharge boundary condition
2.2
5 min
3/s. Figure 37 shows
was held at 100 m
10 min
2.1
20 min
the water depth and velocity at 0, 5, 10,
120 min
20, and 120 minutes for an initial local
2.0
increase in depth. By 5 minutes, the ini-
1.9
tial water storage "lump" is flattened by
1.8
gravitational forces acting in the up-
stream and downstream direction. It then
1.7
0
1000
2000
3000
4000
5000
x Location (m)
slowly "drains" through the downstream
end of the system with time, reaching
0.8
steady uniform flow conditions by 400
0 min
minutes. The water velocity depicted at
5 min
0.7
time 0 is that associated with the onset of
10 min
20 min
the simulation and not the initial condi-
120 min
0.6
tions. The ice thickness remained constant
at the initial value, and hence ice velocity
0.5
remained equal to zero throughout the
run. Figure 38 gives the initial and final
0.4
water surface level profiles for this run,
0
1000
2000
3000
4000
5000
showing the impossible nature of the ini-
x Location (m)
tial water levels. A second, similar run Figure 37. Water depth and velocity pro-
looked at a local decrease in depth. Fig- files at various times for the initial condi-
ure 39 shows the water depth and veloc- tion of local depth increase.
ity at 0, 5, 10, 20, and 120 minutes. In this
run, the initial water storage deficit sends
8
negative gravity waves both in the up-
Initial WSL
stream and downstream directions. The
6
deficit slowly fills with time, reaching
steady, uniform flow conditions by 400
Final WSL
4
minutes. Figure 40 shows the initial and
final water-surface level profiles for this
2
run.
Bed
Another run was made using initial ice
0
jam thicknesses that would result in im-
0
1000
2000
3000
4000
5000
x Location (m)
possible water levels. For this run, the
steady, uniform depth of the baseline con- Figure 38. Initial and final water surface
dition (1.73 m at a steady flow rate of 100 level profiles for depth increase.
61


 Previous Page
