of the filter leaf tests, which demonstrated that a
sludge layer of this thickness was possible. Three
trays were used in each test.
For thin layers, the freezing time can be pre-
dicted from the equation (Vesilind 1990)
ρf Lε
tf =
(1)
hc (Tf - Taf)
where tf =
the freezing time (hours)
ρf =
the density of ice (917 kg/m3)
L=
the latent heat of fusion (93 W-h/kg)
ε=
the thickness of the sludge layer (0.006
m)
Tf = the freezing point of sludge (0C)
Taf = the average air temperature in the
coldroom (C)
hc = the average convection coefficient
(W/m2-C).
This equation assumes that the sludge is already
at the freezing point before entering the coldroom
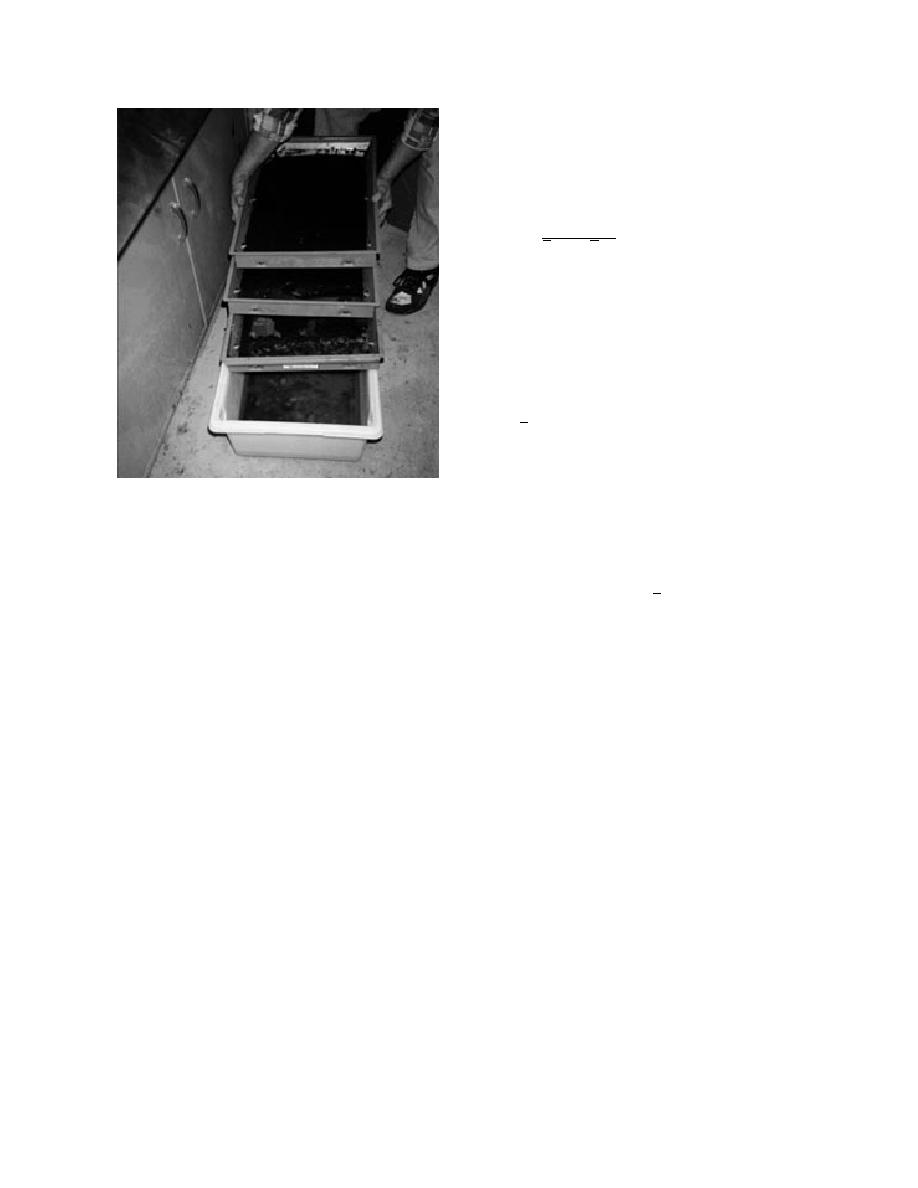
Figure 6. Nest of sieves (no. 30, 50 and 100) used to
and that freezing occurs from the top surface
concentrate alum sludge to 6% and 12% total solids.
downward. We attempted to comply with these
assumptions by precooling the sludge in a 0C
and decanting the supernatant. To produce the 6
and 12% batches, we had to filter the sludge
coldroom and by insulating the bottom of the
through a series of large sieves (see Fig. 6). These
trays. The only unknown in eq 1 is the value of
sieves rested on a rectangular container that col-
lected the filtrate as well as any particles passing
study (see App. B), the average convection coeffi-
the sieves. After pouring sludge onto the sieves,
cient in the coldroom was calculated to be 23.1
W/m2-C.
we covered them with plastic wrap, a board, and
various weights. The purpose of the plastic wrap
The actual freezing time was determined by
was to prevent drying, and the purpose of the
observing the bottom of the sludge layer through
board and weights was to increase pressure on
the transparent freezing tray. We knew that a
the sludge. We monitored the filtration process
sludge layer was completely frozen when it be-
by periodically analyzing the total solids content.
came transparent due to presence of clear ice
After the desired total solids content was
crystals.
achieved, the sludge was removed from each
The difference between the actual and predicted
sieve, mixed together, and stored in a container.
freezing times was less than one minute on aver-
age. However, the standard deviation was 32.3
The particles in the filtrate were also added to the
container after they were separated from the wa-
minutes and differences ranged from 48.3 to 88.7
ter by a series of steps, including filtration
minutes (see App. C). The reason for these large
through no. 200 and 400 sieves, decanting, and
differences were due, at least in part, to slight dif-
evaporation (without allowing the sludge parti-
ferences in mass content. Under the same condi-
cles to become dry). As a result none of the solids
tions, a tray containing a greater mass of sludge
were lost and the batch contained the full spec-
took longer to freeze than one with less. When
trum of sludge particle sizes.
adjusted for mass, differences in freezing rates
To simulate layer freezing, the sludge was fro-
were reduced but not completely eliminated. For
zen in shallow trays made from clear plastic
the purpose of this experiment, an accurate pre-
acrylic. This material was chosen because it
diction was not necessary. We used the actual
allowed a visual observation of the underside of
freezing times to calculate all freezing rates.
the sludge layer. Each tray is designed to freeze a
The procedure used to freeze sludge in the
layer 360 mm in diameter and 6 mm thick. A
trays is as follows:
thickness of 6 mm was chosen based on the results
1. The three trays and sludge were placed in a
8


 Previous Page
