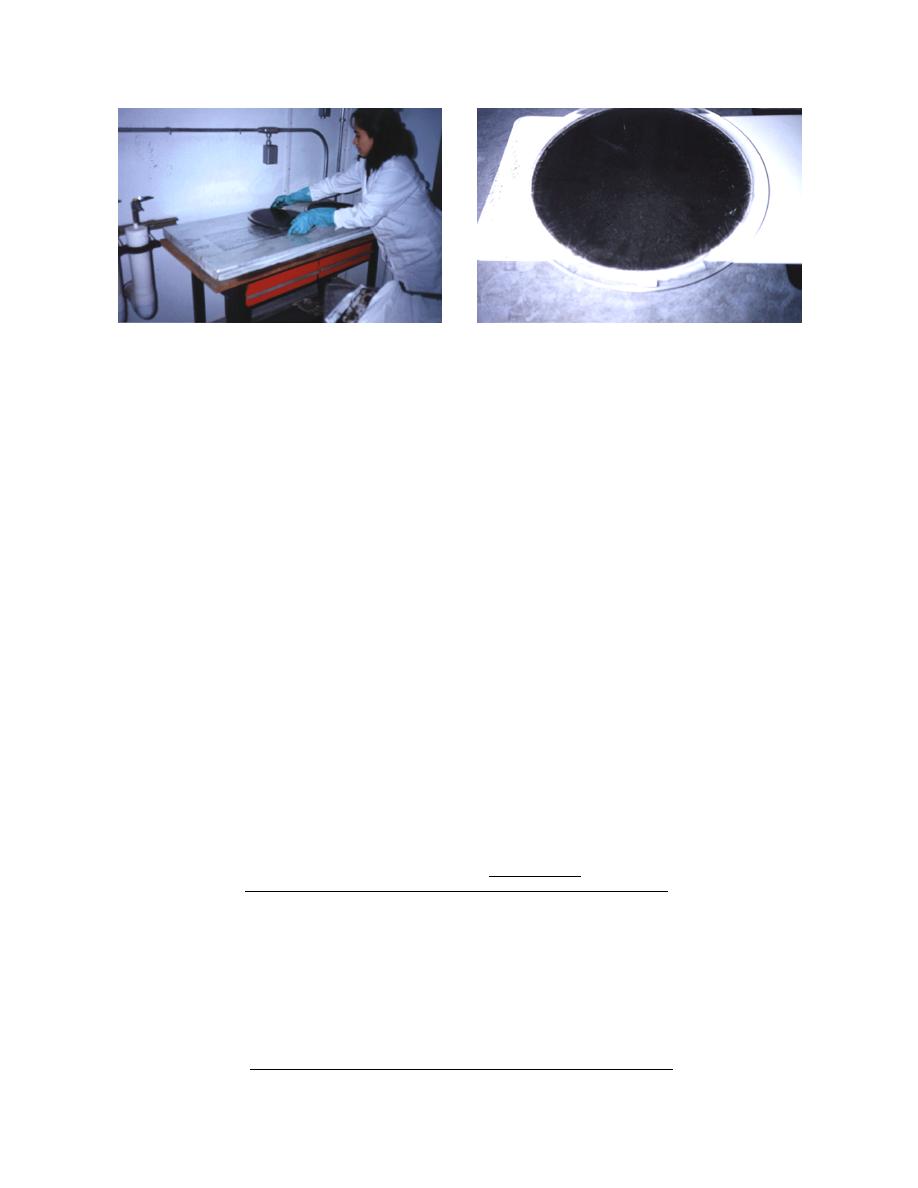
Figure 8. Tray of frozen alum sludge.
Figure 7. Placing a tray containing alum sludge in a
coldroom.
0C coldroom until they reached ambient
night in order to allow the solids to dry out.
4. In the morning, each tray was placed in an
temperature. The purpose of this step is to
oven at 104C for one hour to complete the
start each test at the same initial tempera-
drying process. The trays were then re-
ture condition.
moved, allowed to cool for 15-minutes, and
2. The trays and the sludge were transferred to
weighed to obtain the dry weight.
a coldroom, which was set at the desired
A grain size analysis was performed on the sol-
freezing temperature. The trays were placed
ids from each tray with U. S. Standard 8-in.-diam.
on a level, insulated table (see Fig. 7). Sludge
sieves 10, 20, 40, 60, 100, and 200. The sieves were
was poured into each tray and spread to a
shaken for 10 minutes using a machine shaker.
uniform 6-mm depth with a plastic scraper.
The amount of solids retained on each tray were
3. For the freezing rate and initial solids con-
then weighed and recorded. Grain size distribu-
tent tests, the trays were removed as soon as
tion curves were then plotted to determine D10
the sludge layer was frozen (see Fig. 8). For
and Cu. Data from the layer freezing tests are
the curing time test, only one of the trays
was removed and the remaining two trays
shown in Appendix C.
were allowed to cure. After removing the
trays from the coldroom, we carried them to
RESULTS
a laboratory where they were weighed and
allowed to thaw at room temperature.
Filter leaf tests
Drainage was accomplished by placing each
Cloth selection
tray at a slight angle so that meltwater could
Because of the large number of filter cloths
drain away without dislocating the solids.
available, we decided to base our initial selection
The trays were left in the laboratory over-
on the ones most likely to produce a clear filtrate.
Table 1. Average turbidity of filtrate from selected filter cloths.
Avg. filtrate
Cloth
Porosity
turbidity
ft3/min
(m3/min)
number*
Material
Weave
(NTU)
515
Nylon
Sateen
23 (0.060.08)
8.9
210
Dacron
Crowfoot
52 (0.060.14)
14.7
2019
Polypropylene
Twill
12 (0.030.06)
17.3
208
Dacron
Crowfoot
14
(0.40)
21.3
Crowfoot 3 1
201
Dacron
37
(1.05)
21.7
Twill 2 2
2015
Polypropylene
18
(0.51)
26.0
525
Nylon
Sateen
5
(0.14)
31.0
507
Nylon
Sateen
25
(0.71)
40.0
2038
Polypropylene
Twill
8
(0.23)
51.0
2016
Polypropylene
Twill
3
(0.08)
62.3
Twill 2 2
2025
Polypropylene
25
(0.71)
66.7
*According to Komline Sanderson Engineering Corp., Peapack, New Jersey.
9


 Previous Page
