100
80
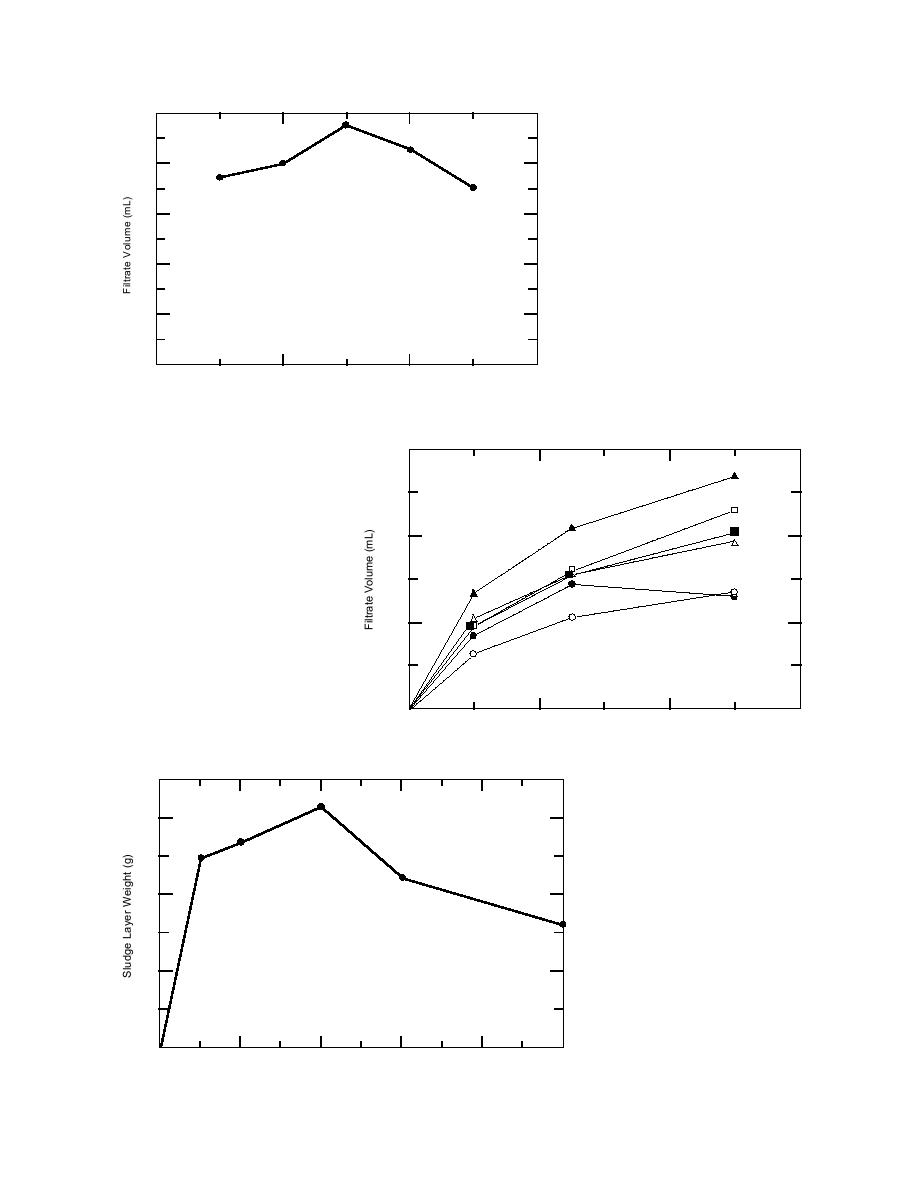
Figure 9. Effect of vacuum level on the
60
volume of filtrate produced by cloth 515
after a 2.0-minute filtration time.
40
20
0
200
400
600
Vacuum (mm Hg)
300
Number 201
210
208
200
515
2015
2019
100
Figure 10. Effect of filtration time on the
volume of filtrate produced at 100-mm
Hg vacuum.
0
4
8
12
Filtration Time (min)
30
20
10
Figure 11. Effect of filtration time on
the weight of the sludge layer accu-
mulated on cloth 2019 at 100 mm of
Hg vacuum in alum sludge contain-
0
2
4
6
8
10
ing 1.85% total solids.
Filtration Time (min)
10


 Previous Page
