Table 12. May to September 1995 sediment accumulation along pond sedimen-
tation transects.
Sediment accumulation (mm)
All measurements
Without disturbance
Cup
Plate
Cup
Plate
Pond
Avg
Std
Avg
Std
Avg
Std
Avg
Std
Bread Truck
5.0
2.2
4.2
1.9
--
--
--
--
C/D
17.7
8.0
--
--
15.6
4.2
--
--
C
11.9
7.7
8.2
7.8
9.2
2.3
5.4
2.4
Lawson's
12.3
9.3
14.3
10.9
9.5
4.1
11.7
8.3
A
7.7
7.8
3.7
5.0
4.6
1.5
2.3
0.9
Racine Island
4.3
2.3
4.7
1.5
--
--
--
--
Left columns include all measurements; right omits sites with disturbance.
20
Fall `95
Cup Measurements
15
10
5
0
Bread
C/D Pond
C Pond
Lawson's
A Pond
Racine Is.
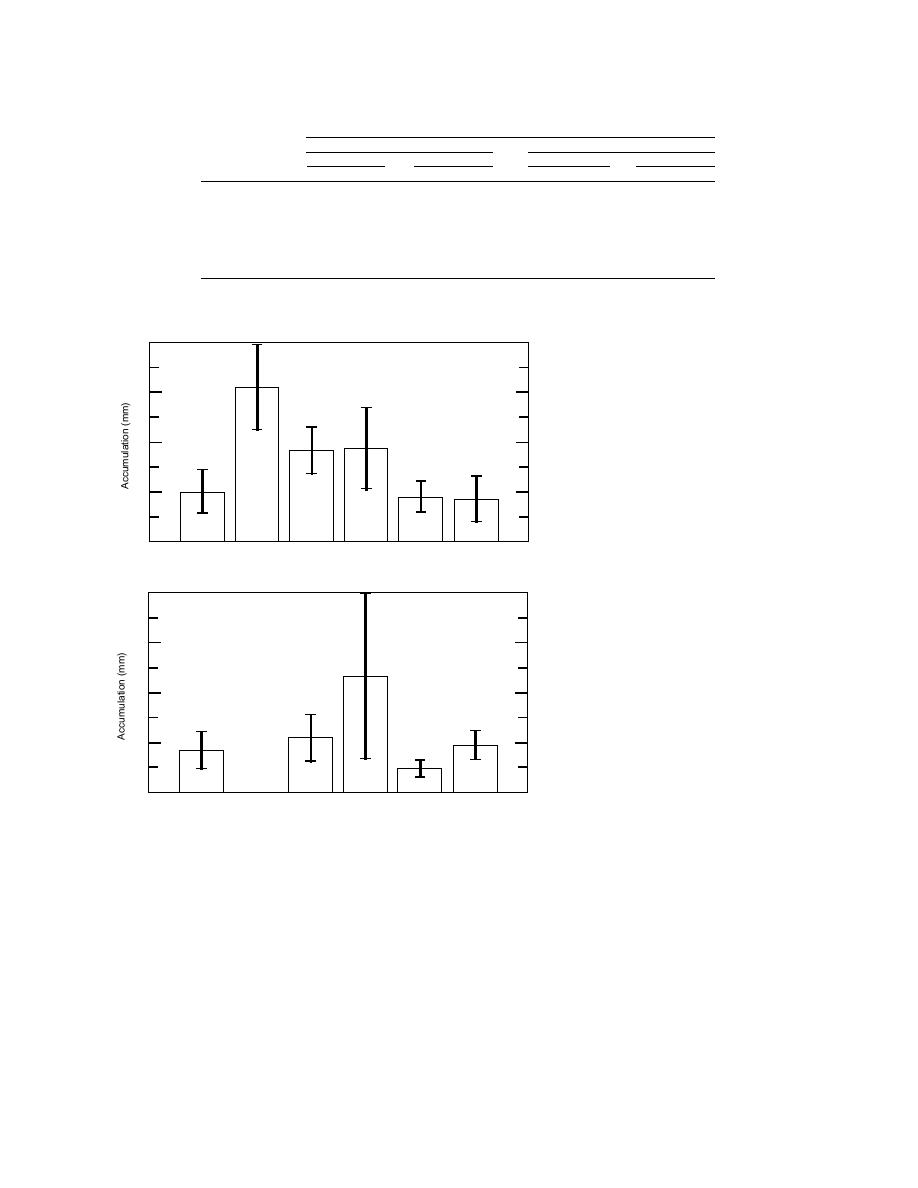
a. Fall 1995 cup measurements.
Truck
20
Fall `95
Plate Measurements
15
10
5
b. Fall 1995 plate measurements (no mea-
0
Bread
C/D Pond
C Pond
Lawson's
A Pond
Racine Is.
surements made at C/D Pond).
Truck
Figure 51. Average sediment accumulation from May to September 1995 at pond sedimentation station transects,
without data points suspected of disturbance. One standard deviation is shown with error bars.
vegetation to help trap sediment. Net sedimenta-
tion stations (Fig. 13 and 52). At these sites, the
tion rates measured by the plates show that Law-
material in about the upper 5 mm is liquefied,
son's Pond has the highest average, but with a
while the lower portion of the accumulated sedi-
large variability. The three ponds--Bread Truck,
ment has undergone dewatering and compaction,
Racine Island and C--had similar net rates of accu-
resulting in a consistency that resists penetration
mulation, while A-Pond accumulations were less.
with a millimeter rule. Accumulation amounts
Longer-term net accumulation rates over 3
were somewhat higher in C Pond than in Bread
years were measured at the isolated sedimenta-
Truck Pond, but in both cases, amounts appear to
58


 Previous Page
