.
σC = 295.22 ε 0.91 φ B0.5
r2 = 0.993
0.21 0.35
σC = 0.73 + 87.44ε φB
S D = 0.09
r 2 = 1.000
S D = 0.02
10
101
a
a
1
0
10
104
0.1
80
106
1
1)
10
60
10 4
te (s
φB , Bulk
40
n Ra
80
108
. , Strai
φ B , Bu
20
6
60
Porosity
ε
10
1)
40
(‰)
lk Por
s
(
n Rate
10 8
20
osity (
ε, Strai
‰
)
10
101
b
b
φ B = 20
φ B = 20‰
1
100
100
100
0.1
10 1 8
108
107
106
105
104
103
10 7
10 6
10 5
10 4
10 3
10
.
ε , Strain Rate (s 1)
ε, Strain Rate (s 1 )
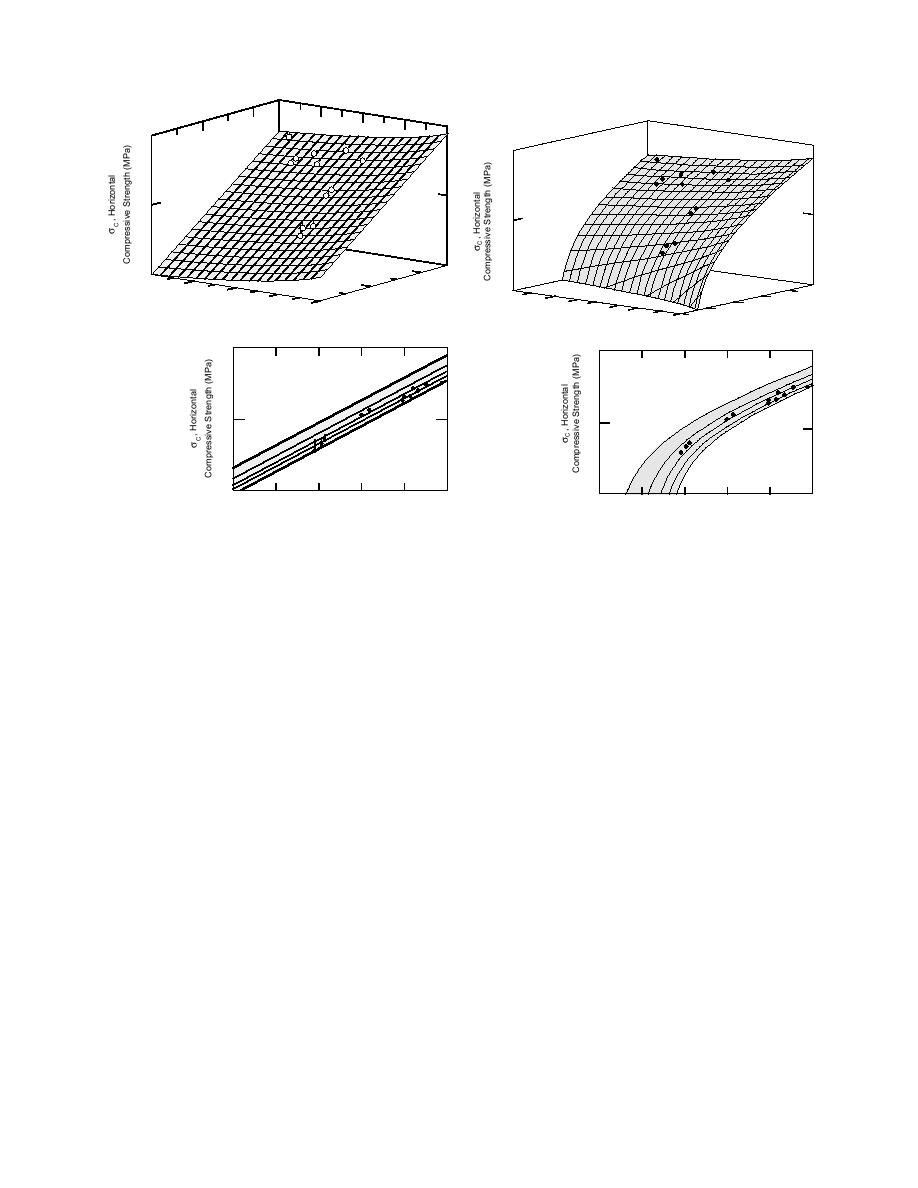
Figure 18. Equation-8-determined ice floe σc strengths
Figure 19. Equation-8-determined ice floe σc strengths vs.
vs. bulk porosity and strain rate (a) and the boresight
bulk porosity and strain rate (a) and the boresight view of
view from the above strain rate window (b).
the above from the strain rate window (b).
low a strain rate of about 106 the failure surface
18b. The three data points at a strain rate of
should be linear, a ≈ 3. However, the existing data
about 106 are shown to be offset from their
predicted failure surface position at the tip of
are insufficient for developing this trend. In the
interim, for strain rates between 104 and 103, the
their vertical tails, suggesting that the failure
surface curves downward. This is not surpris-
equation given in Figure 18 is preferred because it
ing if B contains a nonlinear viscosity compo-
does not contain a second constant. The equation
for the failure surface when νB is substituted for
nent. In this case, while stress is still a func-
φB in Figure 18 is σc = 150.75 ε0.31 νB0.36 . In this
˙
tion of strain rate, it is not directly proportional
(Mellor 1986), at least at strain rates between
volume or the porosity. In using either σc ex-
about 105 and 103 as indicated by the stress
vs. strain rate curves for fresh and saline ice
pression, the only parameters needed are the load-
given in Sanderson (1988). The Exxon data
ing strain rate and the bulk ice porosity or brine
fall in the ductile-to-brittle strain rate transi-
volume. The latter may one day be estimated from
tion region where the creep power-law may
remote conductivity measurements along with ice
not be valid, that is, ε ≠ Bσn because n is no
˙
thickness using a helicopter-borne electromagnetic
longer a constant.
induction sounding system (Kovacs and Holladay
A statistically more representative failure
1990).
A comparison of the σc data derived from us-
surface for the data is shown in Figure 19a.
This curved surface fits the data with a cor-
ing eq 8 with the horizontal uniaxial unconfined
relation coefficient of r2 = 1.000. A boresight
compressive strength data of others should be of
view of the data from the strain rate window
interest. The data compiled by Sanderson (1988;
in Figure 19a is shown in Figure 19b. Based on
see his Fig. 4.8) are shown in Figure 20 for the
the data presented by Sanderson (1988), be-
strain rate range of our data. In this standard
11


 Previous Page
