0.32 0.95
σC = 1970ε
φB
σC = 0.58 + 271.20 0.22 φB 0.63
ε
r 2 = 0.941
r 2 = 0.929
S D = 0.25
S D = 0.29
101
a
1
10
a
10 0
0
10
10 1
10 4
10 1
10 4
90
6
80
1
10
(s )
70
60
Strain Rate
φ B , Bulk
6
50
8
40
10
80
10
1
ε
(s )
φB, Bulk
,
Porosity
60
10 8 train Rate
(‰
40
)
Porosity
ε, S
(‰)
101
101
b
b
φ B = 40‰
φ B = 40‰
10 0
100
100
100
10 1 8
10 1 8
10 7
10 6
10 5
10 4
10 3
10
10 7
10 6
10 5
10 4
10 3
10
ε, Strain Rate (s
ε, Strain Rate (s 1)
1
)
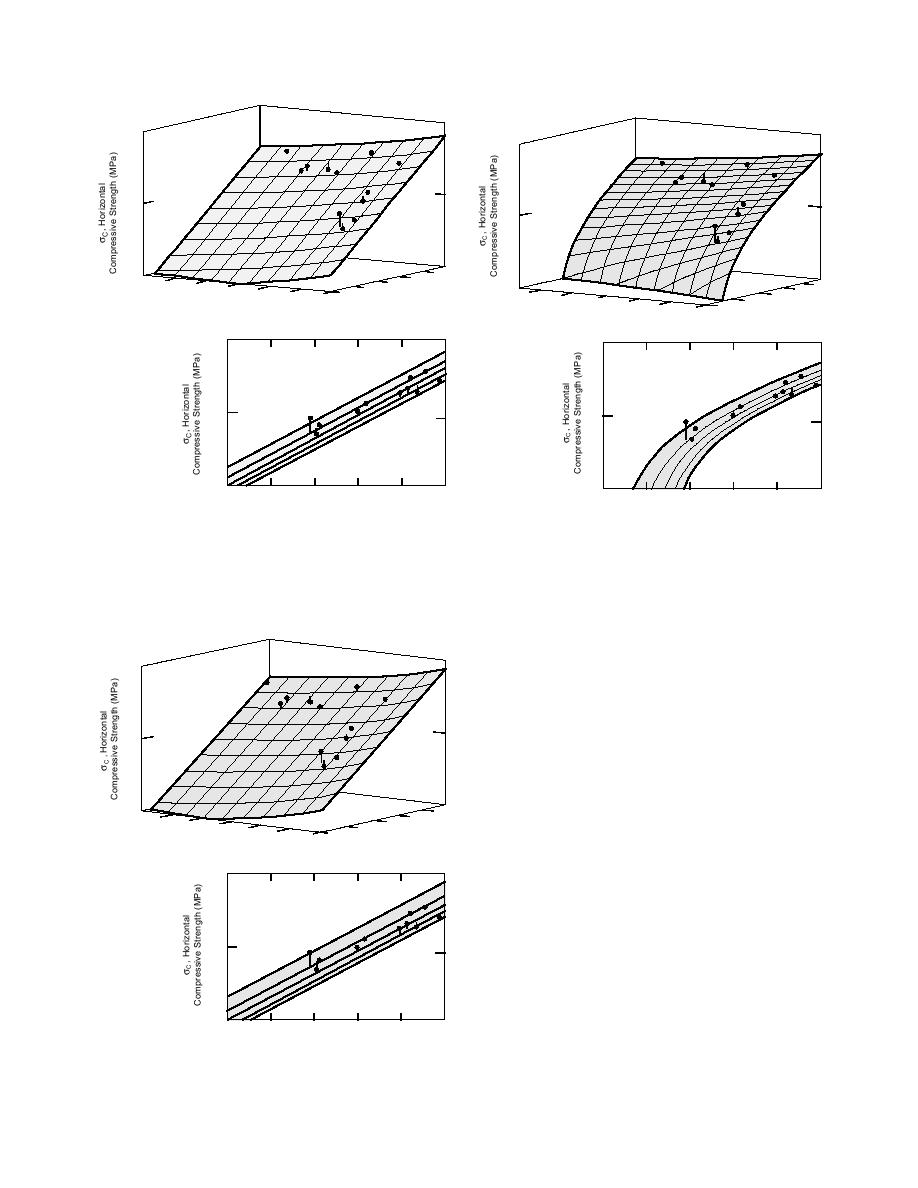
Figure 22. Exxon ice floe σc values vs. bulk porosity and
Figure 23. Ice floe σc values vs. bulk porosity and strain
strain rate (a) and the boresight view of the above from the
rate (a) and the boresight view of the above from the strain
strain rate window (b). Data were fitted with a two-term
rate window (b). Data were fitted with a non-log-log
power function, i.e., eq 9.
power equation.
σC = 523.24ε 0.32 νB 0.67
r 2 = 0.938
S D = 0.26
101
a
100
10 1
10 4
νB , Bu60
10 6
1 )
40
(s
lk Brine
Rate
20
10 8
Volume
in
ε, Stra
(‰
)
101
b
ν B = 20‰
0
10
100
Figure 24. Ice floe σc values vs. bulk brine volume and
1
strain rate (a) and the boresight view of the above from the
10
10 8
10 7
10 6
10 5
10 4
10 3
strain rate window (b).
ε, Strain Rate (s 1 )
13


 Previous Page
