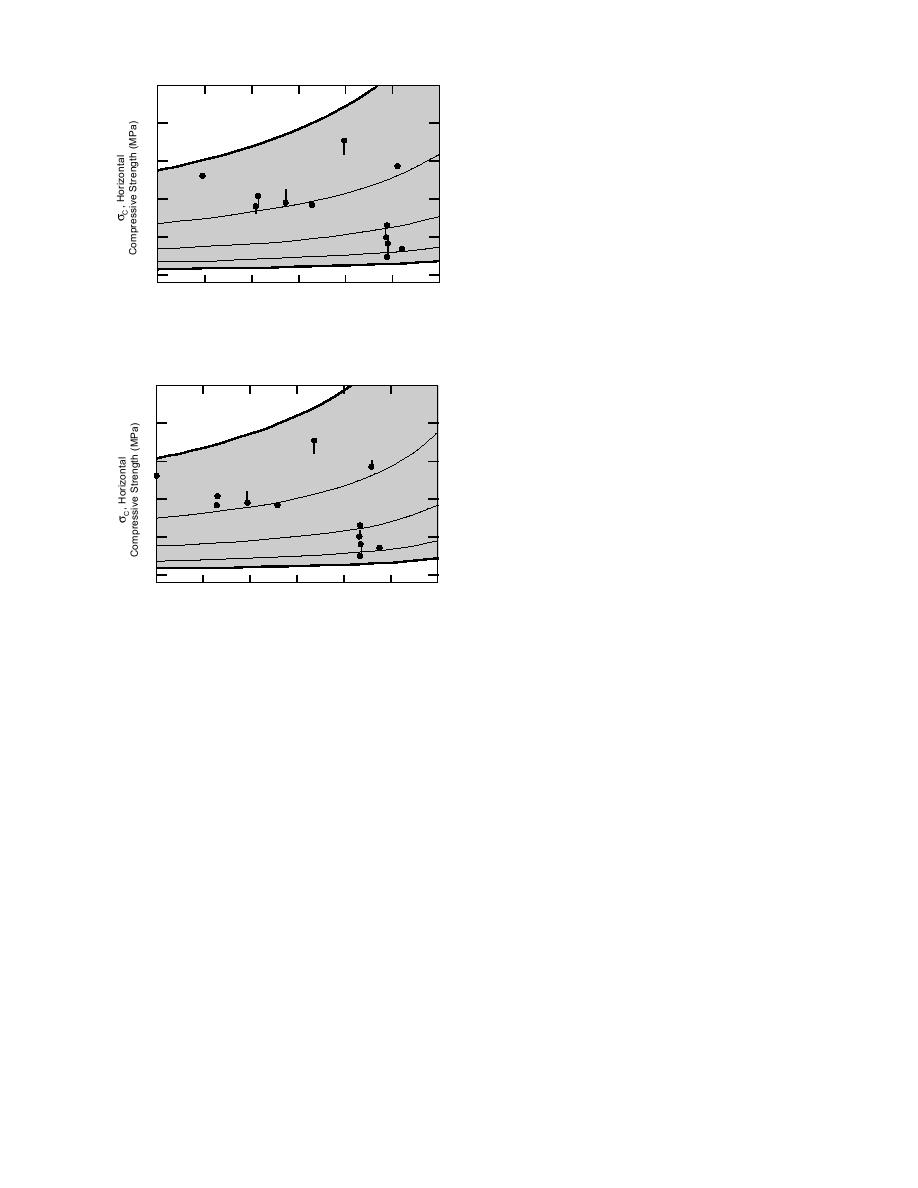
ficantly greater at the higher strain rates. As would
5
be expected, the same trend is maintained when
νB is substituted for φB (Fig. 26).
4
ε = 10 3
If one assumes that n and m are 3 and 1 re-
spectively, then eq 10 can be simplified to
3
σc = 2.7 103 ε1/ 3 φ-1 .
˙
(12)
B
2
σc values calculated from eqs 10 and 12 were
compared and found to cross-correlate with an r2
1
= 1.000 and a standard deviation of 0.012 over the
10 7
range of the Exxon full-scale test data.
0
100
80
60
40
By rearranging eq 9, one obtains an equation
φ B , Bulk Porosity (‰)
for the secondary creep of sea ice:
Figure 25. Boresight view from the bulk porosity win-
ε = B3 σnφw ,
˙
(13)
dow in Figure 22a.
-
where B3 = B2 n and w = mn.
5
To take into account the creep process of ice
ε = 10 3
with time, eq 13 can be modified to describe pri-
4
mary creep as follows:
3
ε = B4 σn φB t λ ,
w
˙
(14)
2
exponents n and m may be) different from those
in eq 13, and λ is an exponent.
1
For a more complete description of the creep
10 7
process of ice under a complex stressstrain state,
0
the reader is referred to the recent work of Fish
80
60
40
20
ν B , Bulk Brine Volume (‰)
(1993).
Figure 26. Boresight view from the bulk brine volume
window in Figure 24a.
ICESTRUCTURE
INTERACTION FORCE
pears to favor a curved failure surface (Fig. 17
and 19), while the trend resulting from the analy-
As is well recognized by engineers engaged in
sis of the Exxon σc vs. ε data does not show a
˙
estimating sea-ice forces on offshore structures,
strong preference. Additional full ice sheet tests
many variables enter into the calculations. In the
should help to further define the failure surface,
following, an estimate is made of the horizontal
especially outside the area of the current data.
force that could develop between a cold first-year
Within the range of the current data, 106s1 < ε <
˙
sea-ice sheet and an offshore structure in the south-
103s1 and ~25‰ < νB < 80‰, eq 11 well repre-
ern Beaufort Sea. In this scenario only the struc-
sents the σc strength of sea ice as determined
ture width (90 m) and the degree-days of seawa-
ter freezing since a stable ice cover formed (5000)
from full-scale in-situ tests. This is equally true
are known. From the work of Anderson (1961),
for eq 10 and its counterpart in Figure 23a, in
which φB is a parameter. Nevertheless, eq 10 is
Wen et al. (1991), and R. Lewellen (pers. comm.),
the relationship between Arctic ice floe thickness
preferred because of its simpler form; it does not
and the cumulative freezing degree-days since a
contain a secondary constant. In addition, out-
stable ice cover formed was determined (Fig. 27).
side the range of this field data, the latter equa-
This curve in Figure 27 is based on sea-ice field
tion predicts an unrealistic zero ice strength be-
tween strain rates of about 107 and 108s1.
measurements with a natural snow cover. From
the equation for the curve in Figure 27, the ex-
The relationship of bulk porosity and strain
pected ice thickness for 5000 freezing degree-days
rate to sea ice strength is clearly revealed in Fig-
ure 25. The effect of φB on σc is shown to be signi-
is 176 cm, and from eq 2 the bulk salinity of the ice
14


 Previous Page
