ture is estimated to be 291 MN or ≈ 3.24
200
MN/m. Since most estimates for the in-
TF = 2 θ 0.505
tegrated limiting pack ice force lie be-
160
tween 104 and 105 N/m (Parmerter and
Coon 1973, Rothrock 1975, Hibler 1980,
Nevel 1983 and Croasdale 1984), the
120
pack ice driving force would seem to be
the design limiting-force load. However,
80
since the pack ice driving force can be
t
θ = ∫o (Tw Ta ) dt
distributed across a floe that is much
t = Time (days)
wider than the structure, the concen-
Tw = Seawater Freezing Temp.
40
Ta = Mean Daily Air Temp. < Tw
trated force at the structure can easily
exceed the stress required to fail the ice.
Therefore, for this model and no other
0
1000
2000
3000
4000
5000
factors being considered, the design
θ, Cumulative -C Freezing Degree-days After Ice Formation
force would be the calculated value.
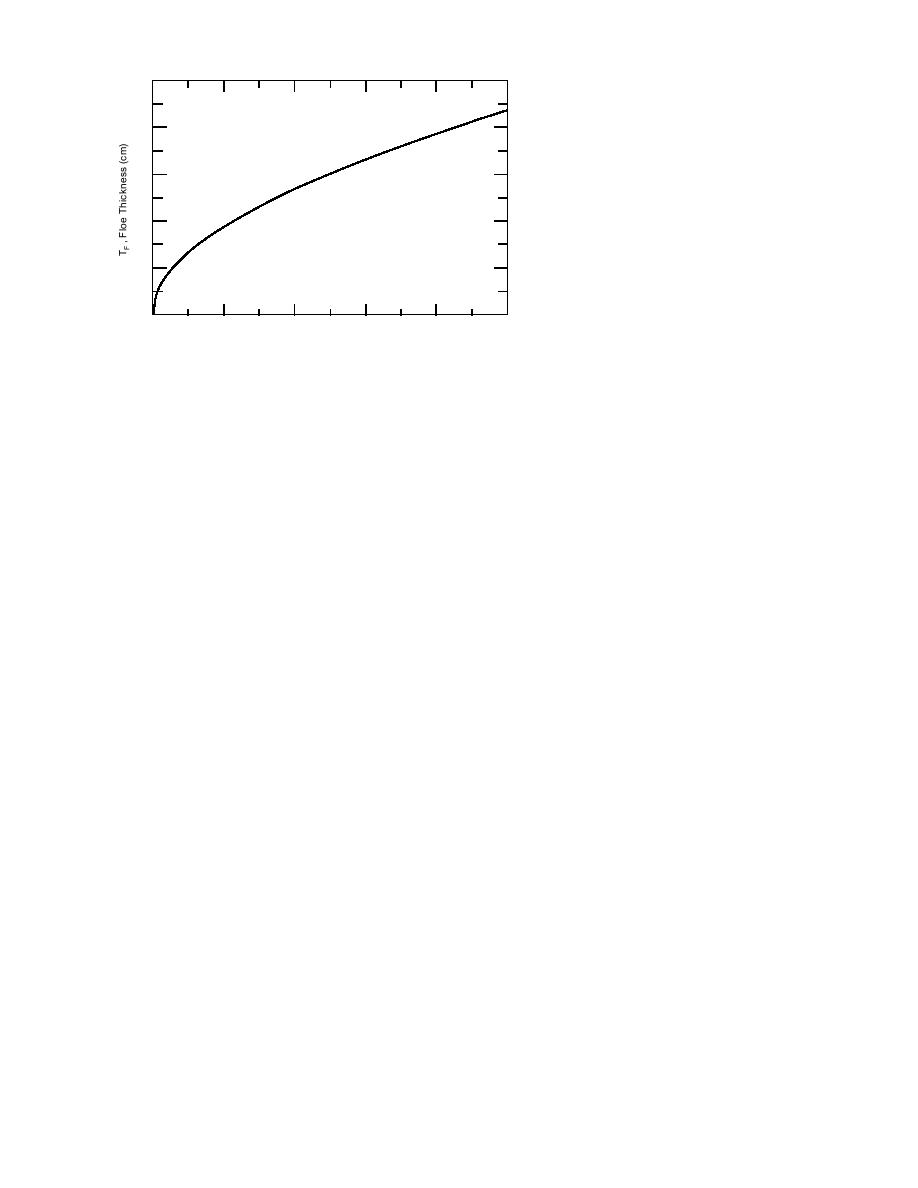
Figure 27. Sea-ice thickness vs. seawater freezing degree-days after
The constants given in eq 15 and 16
a stable ice cover has formed.
are best estimates and may need to be
revised (Sanderson 1988). The estimated
force of 291 MN is considered an upper limit for
sheet is estimated to be 5.15‰. We assume the ice
the conditions given. Indeed, for a similar ice sheet
sheet has an average temperature of
10C. This is a reasonable value for cold, late-
thickness and structure width, the ice force devel-
oped against the structure due to nonsimultaneous
winter first-year sea ice along the Alaska Beaufort
ice crushing failure appears to be less than half
Sea coast. The bulk porosity is found to be 52.20‰
-
from the equation, φB = 19.37 + 36.18 S B.91 Ta 0.69 ,
0
the above calculated indentation force (Wright
and Timco 1994).
given in Figure 13a.
The peak failure stress in sea ice occurs at a
strain rate of about 103s1 for small-scale ice
SUMMARY
samples with an aspect ratio less than 2. As the
sample size or the volume of ice under load in-
A constitutive relationship, in the form
creases, the peak stress occurs at a lower strain
σc = B2 εl/n φm , was developed for predicting the
˙
rate (Sanderson 1988, Gavrilo 1995). At full-scale
B
unconfined compressive strength of first-year sea-
ice structure interaction when the aspect ratio is
ice floes as a function of only two parameters, the
greater than 50, the peak stress appears to occur
at an effective strain rate εe around 105 s1. Since
applied strain rate and the ice floe bulk porosity.
˙
This equation was evaluated using full sea-ice
the structure width d is very much greater than
sheet thickness, horizontal unconfined compres-
TF, plane stress conditions apply and the appar-
sion test data, so no uncertain small- to large-
ent ice sheet velocity V at this strain rate is
scale scaling laws were involved. The magnitudes
(Sanderson 1988)
of the parameters in the equation were found to
be σc = 2.7 103 ε1/ 3 φ1. Using this relationship,
˙
V = εe 0.44d
˙
(15)
an example is given for estimating the design
or 1.4 m/h. Using 52.2‰ for φB and 105 s1 for ε
sea-ice crushing force against a 90-m-wide off-
˙
shore structure.
in eq 5 gives 1.6 MPa for the ice sheet peak hori-
Relationships are also provided for determin-
zontal uniaxial unconfined compressive strength.
ing ice sheet tensile and flexural strength. The
For plane stress conditions, the indentation force
relation between sea-ice bulk conductivity and
F between a vertical structure and the level ice
strength was explored. First-year sea-ice thick-
sheet may be estimated using the reference stress
ness can currently be measured using surface or
expression (Sanderson 1988)
airborne systems. It is predicted that one day ice
F = 1.15 dTF σc.
sheet conductivity will also be remotely measured
(16)
and that this will lead to the capability of re-
For d = 90 m, TF = 1.76 m and σc = 1.6 MPa as
motely estimating sea-ice strength.
Two widely used methods for calculating the
given above, the global ice force against the struc-
15


 Previous Page
