Figure 17 are from Tables 1 and 2 and the sources
alyzed using a two-parameter power function.
cited above. This figure indicates that nonde-
The relationship is a further development of the
formed Beaufort Sea ice floes have a gas volume
Norton (1929) secondary creep rate equation con-
taining a power function of stress:
between about 1 and 2%.
The σc values calculated using eq 8 in relation
ε = Bσn ,
to the controlling parameters ε and φB can be an-
˙
˙
where B is an empirical parameter that takes into
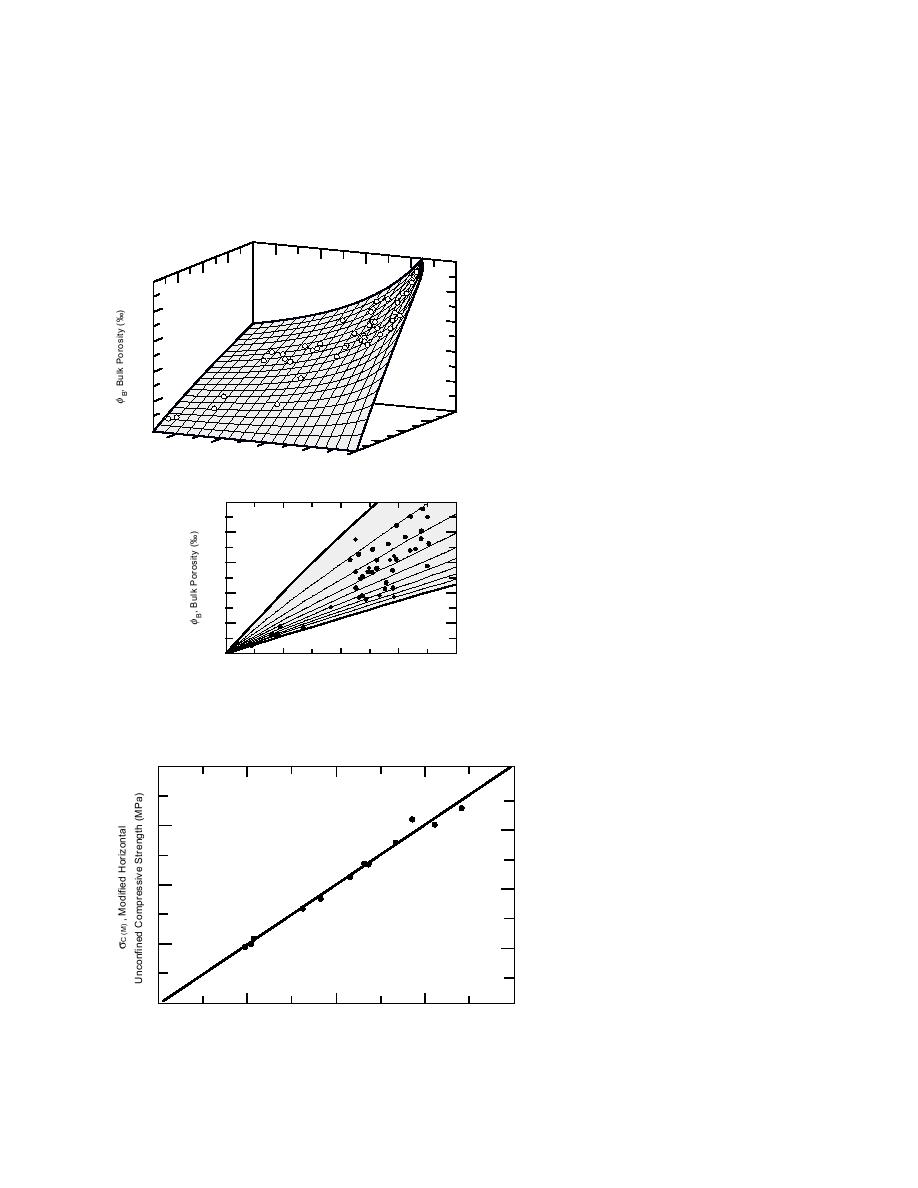
φ B = 19.37 + 36.18 S 0.91 T 0.69
account ice structure, temperature, activation en-
B
A
ergy, and other factors, σ is the applied stress, and
r2 = 0.995
S D = 1.57
the empirical exponent n is generally found to be
about 3 for ice. Rearranging for σ, the above equa-
120
tion becomes
a
100
σ = B1 ε 1/n ,
˙
80
60
by Glen (1955, 1958) to evaluate the creep behav-
ior of solid, not porous, freshwater ice. Since the
40
ice porosity has a profound effect on σ, the above
8
6
equation must be modified to include a porosity
20
(‰)
4
ity
10
parameter φ as follows:
alin
8
2
6
lk S
4
TA , Avg. Fl
0
Bu
2
S B,
oe Tem
p. (|C |)
σ = B2 ε1/n φm ,
˙
(9)
120
where B2 = B1 φm and m is an empirical exponent.
b
100
Equation 9 was evaluated by substituting the
2 C
σc values obtained from eq 8 for σ in eq 9 and
80
using the related controlling parameters φB and ε
˙
given in Table 3. The result is shown in Figure 18.
60
Equation 9 is shown to statistically fit the data
11 C
extremely well with an r2 value of 0.993.
40
As more data become available, the failure sur-
20
0
2
4
6
8
face and therefore the variables in eq 9 may be
S B, Bulk Salinity (‰)
better determined. Even though the failure sur-
face fits the data with a high r2 value of 0.993, the
Figure 13. Ice floe bulk porosity vs. average temperature
and bulk salinity (a) and boresight view from the above
data suggest that this surface is not a straight line
bulk salinity window (b).
as viewed from the strain rate window in Figure
4
3
2
1
σC (M) = 0.016 + 1.007 σC (T-F)
r 2 = 0.989
S D = 0.09
0
1
2
3
4
Figure 14. Modified TimcoFrederking ice
σ C (T-F) , Timco-Frederking
floe σc strengths vs. their original values.
Horizontal Unconfined Compressive Strength (MPa)
9


 Previous Page
