ogy and water quality of ERF. A ma-
jority of sampling sites were in small
plunge pools at the heads of tidal
gullies throughout the Flats (Fig. 16).
The Mortar and Spring gully sites
Fo
are located along drainages that re-
Eo
F
ceive tidal waters directly from Knik
Arm. The sites at Bread Truck, Para-
E
F1
chute, B, Tanker and Otter gullies
D
are located in drainages that flow to
C
the Eagle River. The Otter Creek site
Co
C2
represents drainage from the south-
B
A
western uplands as well as Area B
mudflats. The two final sites repre-
N
sent the primary source waters: the
Eagle River upstream of where it en-
ters ERF, and the Knik Arm just
P
Eagle River
north of the coast (Fig. 16).
I ermanent Pond
At the nine gully locations (hydro-
D termittent Pond
n
station sites) (Fig. 16), a basic suite
Srainage Gully
of water characterization data was
urveyed Gully
collected at 4-minute intervals. These
data include temperature (measured
0
500 m
by thermistor or a Hydrolab H2O
multiparameter sensor, or both); sa-
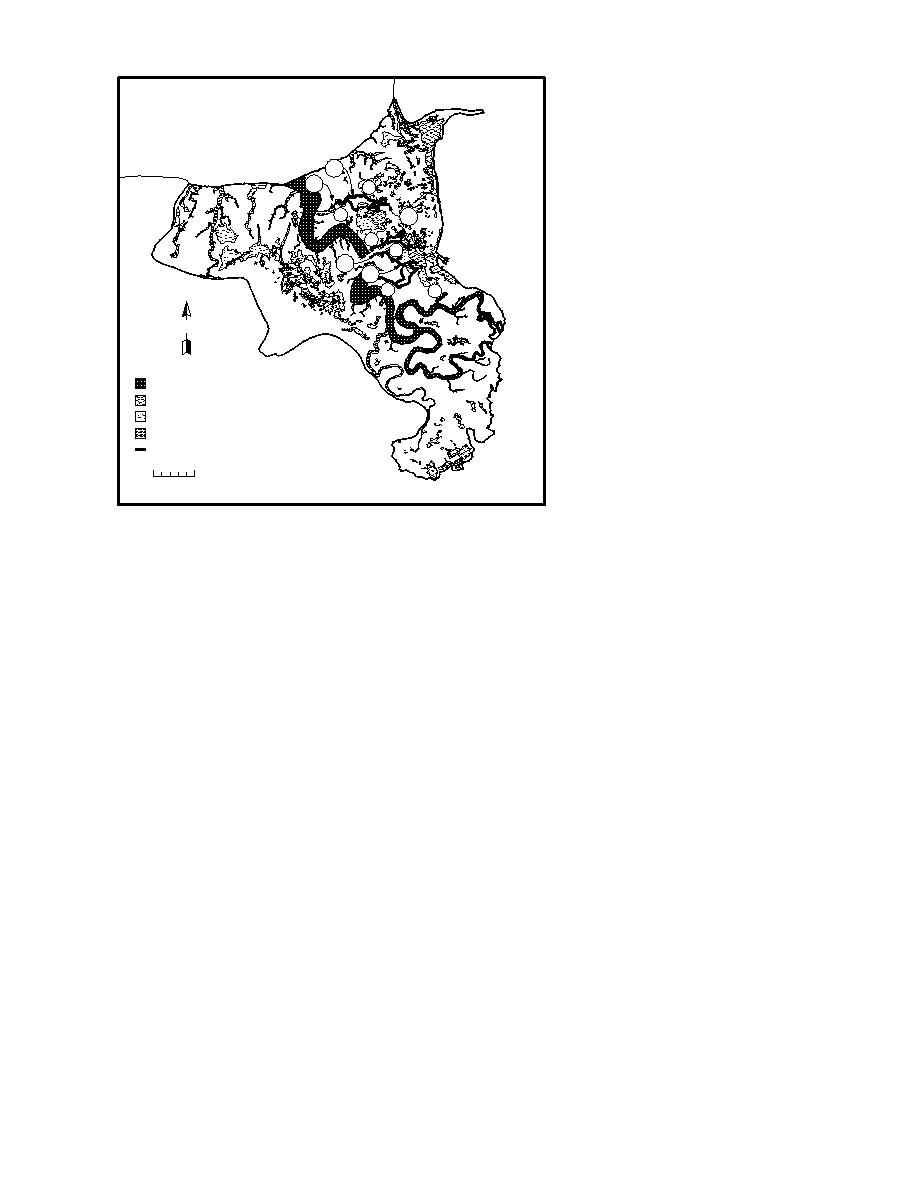
Figure 15. Location of surveyed longitudinal cross sections of gullies.
linity, pH, redox and dissolved oxy-
gen (Hydrolab); turbidity (OBS3 op-
data will define the amount of erosion occurring
tical backscatter sensor); and water surface
between September and the initial period of
elevation (Druck pressure transducer) (Table 8).
freezeup. Repeat measurements at points with-
From August to September 1993, data were col-
out any retreat (as indicated by the continuing
lected at three sites: Parachute Gully, Bread Truck
presence of wire flags) show that they are repro-
Gully and Eagle River. These three sites were
ducible to 25 cm. The accuracy, however, is
reestablished in May 1994, and other sites were
limited by how well the crest of the gully scarp
added later as equipment became available
can be defined; the gully scarp is highly irregular
throughout the 1994 season (Fig. 17). In addition,
and, therefore, accuracy is probably limited to
500-mL water samples were collected for analyz-
10 cm in the worst case.
ing Total Suspended Sediments (TSS) during flood
Longitudinal cross-sections of nine gullies were
and ebb cycles at each hydrostation and in the
surveyed in 1993, beginning at or near the Eagle
nearshore zone of Knik Arm.
During the fall of 1994, two sensors were added
River and continuing into the ponds (Fig. 15).
to measure current velocity and water level. A
Gradients were calculated from these data for
MarshMcBirney electromagnetic current probe
characteristic reaches of each gully. Gradients
was mounted about 1 m above the bed at the
were incorporated into empirical estimates of
Bread Truck, Parachute and Spring gully sites
gully discharge at surveyed cross sections for
(Fig. 16). Ultrasonic sensors by Campbell were
maximum or bankfull ebb (Lawson et al. 1995).
installed at Otter and Spring gullies and the
These data signify the relative stability of the
weather station adjacent to Knik Arm to monitor
drainage system, and therefore may provide in-
flooding duration and height above the mudflats.
formation to allow us to assess both short- and
Water characterization data were also collected
long-term trends in gully erosion and pond sta-
using Seabird CTD (mdl 19) Profilers (Table 8)
bility.
over shorter time periods at a variety of sites in
gullies and the Knik Arm (Fig. 16). Also, a Sea-
Water quality parameters
Various types of data have been collected at
bird model SBE 26 wave and tide gauge was posi-
several sites to help us assess the surface hydrol-
tioned north of Area D to record water depth and
17


 Previous Page
