August and September 1992 follow-
ing each monthly period of tidal
flooding, while seasonal rates were
measured in May and September of
both 1993 and 1994.
Line 12
The amount of accretion at tran-
sect survey points was also moni-
tored by spraying an area (~30 30
e2
Line 10
Lin
cm) on the ground surface with
1
e1
Lin
Line 3
Line 5
pavement marking paint and locat-
ing the corners of this area with wire
Line 7
Line 4
survey flags (see also Vince and
Lin
e9
Snow 1984). Net accumulated sedi-
18
Lin
Line 8
ne
e
ment is measured by cutting and re-
Li
Li
19
ne
Line 6
N
moving a ~2- 2-in. (~0.03- 0.03-
20
23
Line
m) block of sediment with a putty
Line 24
knife (Fig. 9). The thickness of sedi-
Eagle River
P
ment above the paint layer is then
I ermanent Pond
measured to the nearest 0.5 mm.
D termittent Pond
n
Paint was applied at certain sites in
T rainage Gully
Line 22
June 1992, August 1992, August 1993
ransect Line
and MayJune 1994. In contrast to
sedimentation stakes that are bro-
0
500 m
ken or removed during winter, the
wire flags and the persistence of bur-
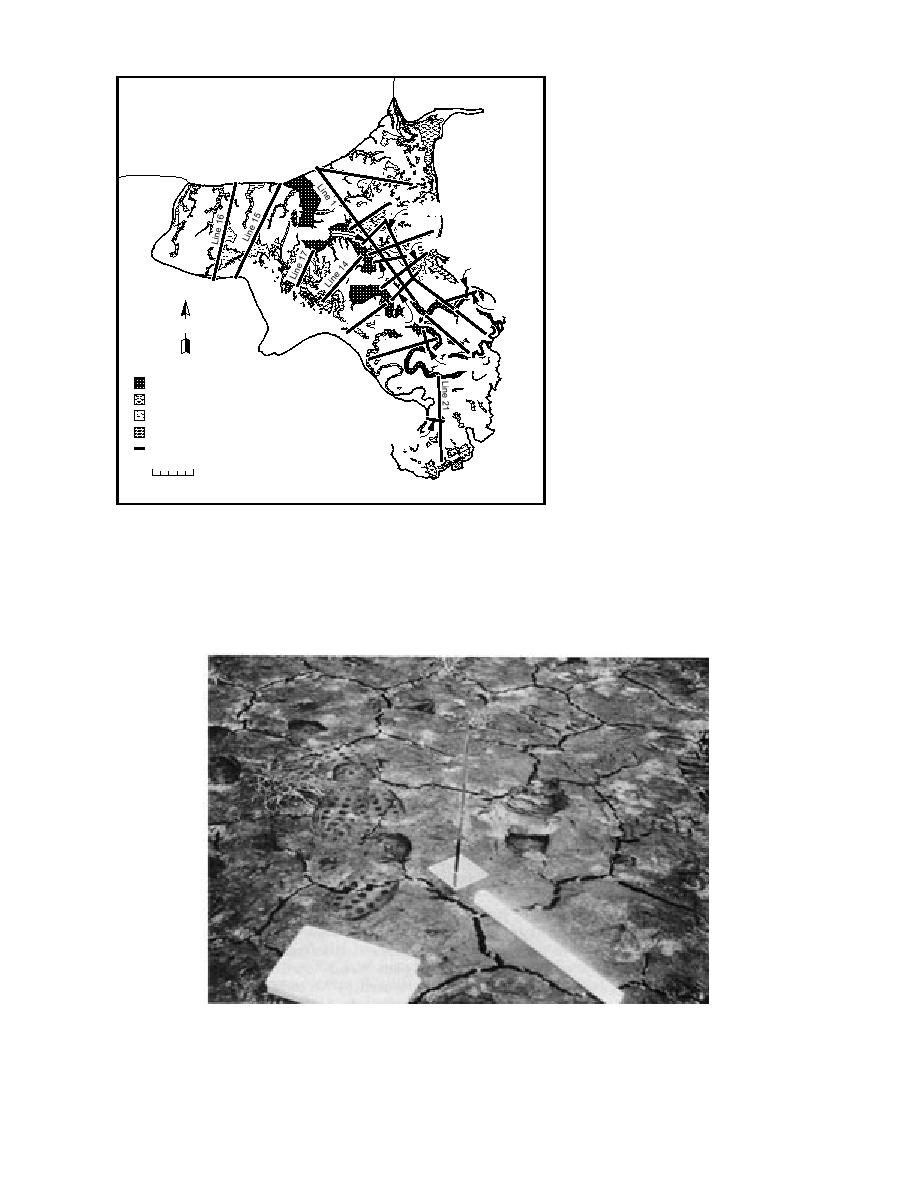
Figure 7. Transect locations.
ied paint horizons allow us to ac-
cally to the nearest 0.5 mm. The amount of accre-
quire a continuous record of net sedimentation
tion is the thickness of sediment deposited on the
rates. Use of the method allows us to account for
plate surface. The difference between these two
sediment compaction through time.
readings defines the net sedimentation (or ero-
Sedimentation rates in ponds were also mea-
sion) rate. Monthly rates were measured in July,
sured at 10 sites following tidal inundations in
a. Sedimentation stake with plate that slides freely on the rod.
Figure 8. Sedimentation measurement techniques.
12


 Previous Page
