All data are standardized to mean An-
chorage sea level, as are all other sur-
Coastal 7
Lin
veyed data in ERF.
e
F
Length of data record
Table 9 summarizes the periods when
Coastal 6
various types of field data were acquired.
The starting dates for acquisition reflect
both the development of new methods
Coastal 5
for these investigations and expansion
to analyze a larger proportion of the
physical system across ERF. Gaps in the
D
e
Lin
records of water quality sensors, other
th
Line H
ou
.M
than during the winter period, resulted
R
le
g
Ea
from either instrumentation failure or
CNew
disruption by natural processes.
oastal
N
TIDAL HYDROLOGY
Coastal 4
AND INUNDATION
Erosional, transport and depositional
Coastal 3
processes are complexly related to Knik
Arm tidal dynamics and Eagle River hy-
A
Coastal 2
Line
drology. Although sufficiently high tides
can flood all of ERF, lower high tides
Coastal 1
may be supplemented by the river's dis-
charge or wind-induced surges (or both)
and flood more area to a greater depth
Selected Transect Line
L
A1 B1 C1 D1 E1 F1
than the predicted tide height indicates.
Tocation of Echo-Sounding
A2 B2 C2 D2 E2 F2
ransect Line
A3 B3 C3 D3 E3 F3
An understanding of the tidal and river
A4 B4 C4 D4 E4 F4
dynamics is critical to the evaluation of
0
500 m
A5 B5 C5 D5 E5 F5
the physical system and WP attenuation.
A6 B6 C6 D6 E6 F6
Several factors influence the timing, mag-
nitude and duration of flooding, each of
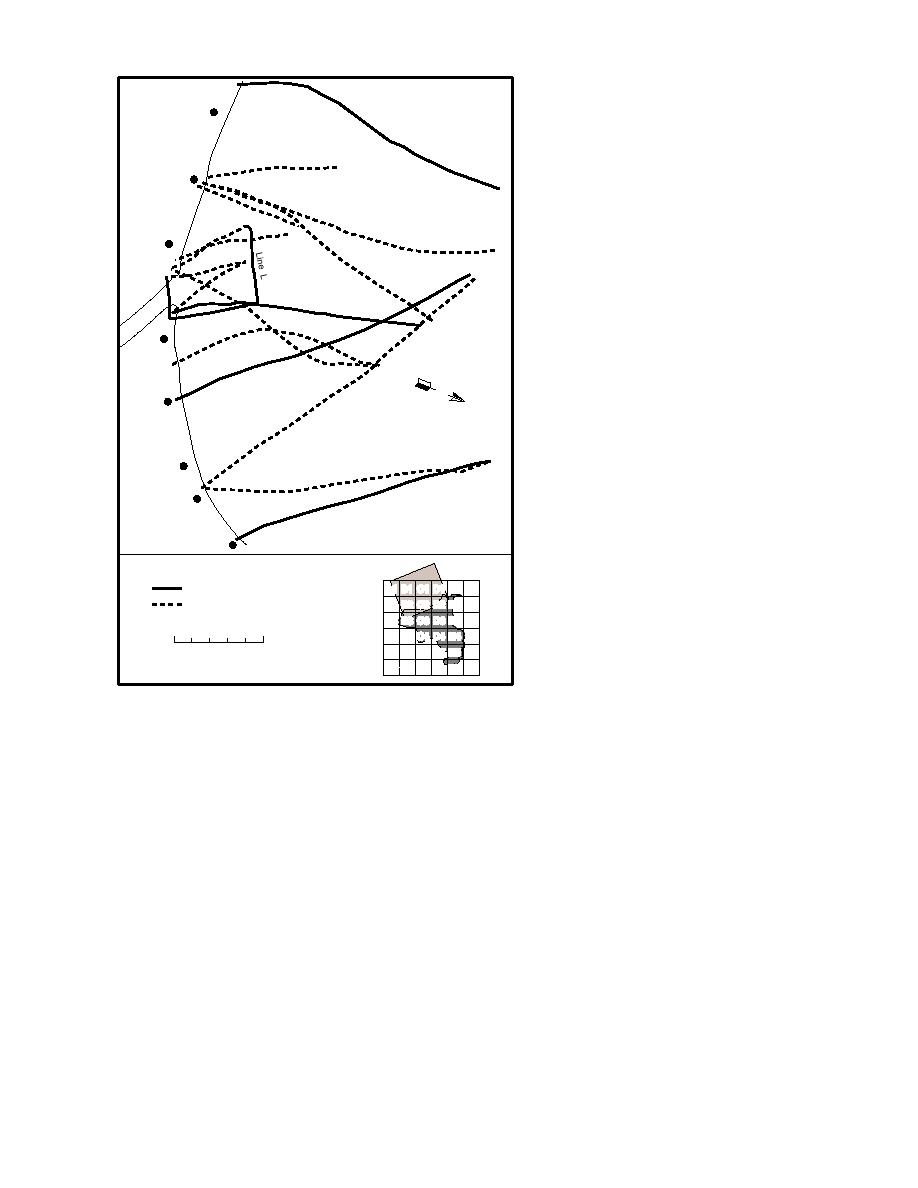
Figure 21. Location of selected bathymetric profiling transect lines.
which must be evaluated since flooding
Survey data have given us highly accurate
drives many of the surface processes and modu-
bathymetric data. Water depth can be read to
lates the moisture-dependent decomposition of
within 10 cm, while survey data provide us with
WP particles (Walsh et al. 1995).
the ability to compensate for variations in tidal
A typical flooding tidal cycle begins with a rise
height (3 m) during bathymetric profiling. The
in the water level in the Eagle River and gullies.
timing of bathymetric profiling was centered
As the tide reaches its peak, the water floods over
around the predicted high tide in Anchorage, pro-
the banks of the gullies, letting it flow over a large
viding us with an appropriate 4-hour window of
area, causing a decrease in the rate of water level
operation each day. This time was chosen to take
rise (Fig. 22). Once the peak is reached, there is a
advantage of maximum flooding so that transect
period of slack high tide when the water is
lines would not be hindered by bars in Knik Arm
dammed upon the Flats. During ebb, the water
and, more importantly, when tidal and fluvial
begins to drain nearest the coast and progresses
currents are minimum around slack high tide.
inland. The channeling of ebb flow into tidal gul-
Elevation data collected during profiling allow us
lies, combined with the dammed fresh water, re-
to subtract tidal effects from the raw bathymetric
sults in a longer runout time than flooding prior
data and adjust the bathymetric records to mean
to complete inundation.
Anchorage sea level. Bathymetry is therefore esti-
The damming of the river water during the
mated to have accuracy that is better than a meter.
flood tide causes the river to slow, pool, and even-
22


 Previous Page
