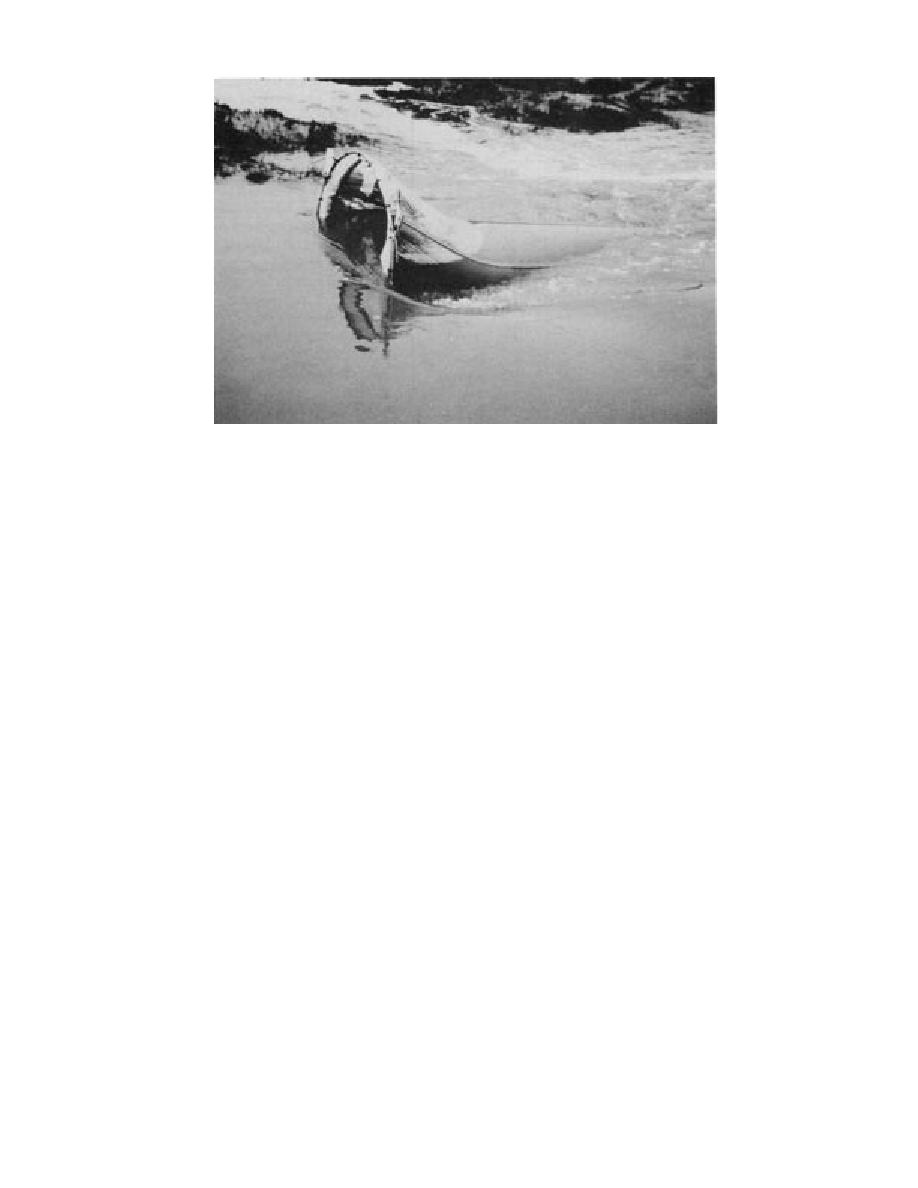
Figure 20. Plankton net used for collection of WP in transport through gullies.
tion of Water and Wastewater (APHA, AWWA, WEF
Bathymetric profiling
Bathymetry of the Knik Arm near the Eagle
1992). Our project modifications to this proce-
River mouth was recorded for the first time this
dure are described in Appendix A.
year to allow us to develop a baseline for assess-
ing erosion and deposition and to help us iden-
WP transport sampling
tify potential areas for WP deposition. Bathym-
A plankton net, 3 m long, with an opening of 1
m and a mesh size of 80 m, was used to sample
etry was measured using a Lowrance fathometer
with a 50-kHz transducerreceiver. On 27 and 28
suspended and bed load sediments transported
July, 20.1 km of fathometer transects were run in
in the gullies during ebb. We then analyzed these
a 2-km-wide portion of Knik Arm just offshore of
samples by standard laboratory methods for the
the Eagle River Flats (Fig. 21).
presence of WP particles.
We made our profiles using a 14-ft (~4.3-m)
The plankton net was tied to stakes driven into
inflatable skiff. The transducer was mounted on
the gully bottom. It extended down-channel in
the transom with angle irons, screwed onto a
the direction of ebb flow (Fig. 20). A cup at the
wooden block made from a 2- 4-in. (5- 10-cm)
apex of the net collected sediments that were
stud that was tightened to the hull with C-clamps.
trapped from water flowing down the gully. Nets
The mounting bracket was wedged so that the
were deployed in the Parachute Gully in May
bracket hung vertically off the stern, and the trans-
1994, in the Bread Truck, Parachute and B gullies
ducerreceiver was mounted on the bracket such
in September 1994, and again in the B-Gully in
that its surface was approximately parallel to the
October 1994. These nets were set during mul-
water surface.
tiple flooding tides to document whether or not
We located and recorded our transects using a
WP was being transported out of the ponds and
mudflats (see White Phosphorus Erosion and Trans-
land-based Total Station. Seven benchmarks were
port section). In addition, grab samples were col-
established along the coast for setting up the sur-
lected from recent deposits in various gullies
veying equipment to track the skiff. Personnel in
across ERF on 4 June, 68 October and 6 Novem-
the skiff pointed a prism and rod towards shore.
ber 1994. Samples of pond and mudflat sediments
Communication between shore and skiff was
frozen-on to ice cover fragments were also col-
maintained to relay navigation commands using
hand-held VHF radios.
lected in Areas C and D in November 1994.
21


 Previous Page
