the largest fraction, typically in excess of 95%. Sea
S i , Ice Salinity (‰)
5
6
7
8
9
ice is classified by age (first-year, second-year,
0
and multiyear) and by morphology (flat, ridge,
rafted, etc.). Variations in growth, melt, and de-
5 Jun
formation processes result in ice formations of
14 May
complex shape and structure and variable brine
and gas content. The sea ice may also contain
40
foreign matter such as sediment (e.g., Barnes et al.
1984, Kempema et al. 1989) and microscopic algae
and diatoms (e.g., Sutherland 1852; Wright and
17 cm
Priestley 1922; Usachev 1949; Buinitskii 1965, 1974;
and many others more recently).
80
ICE FLOE BRINE VOLUME
AND SALINITY
120
A number of factors affect the volume of brine
that is initially incorporated into the sea ice. Fore-
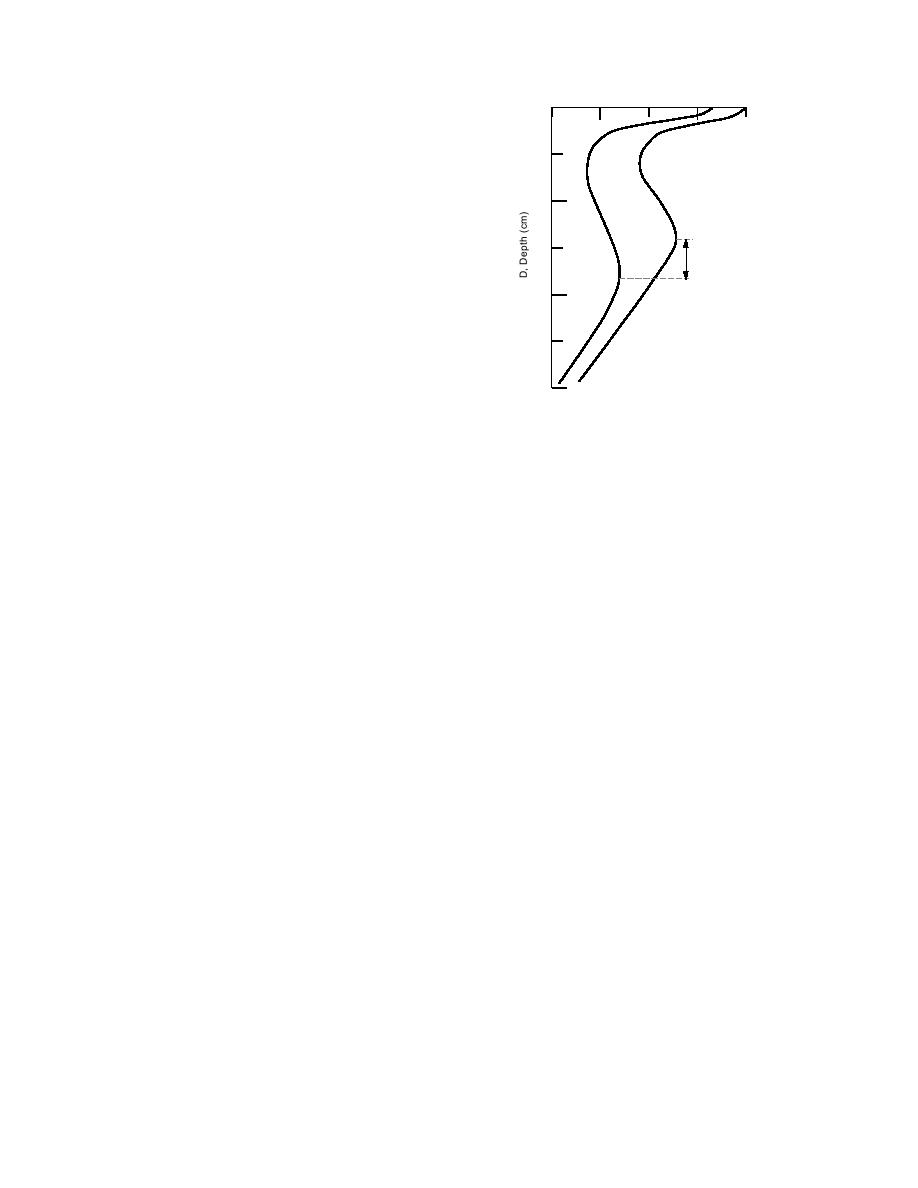
Figure 5. Major 17-cm brine wave mi-
most is the salinity of the seawater, the ice growth
gration event observed in Antarctic fast
rate and structure. Under extreme cold condi-
sea ice between 14 May and 5 June
tions, accelerated growth occurs, and more brine
(after Doronin and Kheisin 1975).
tends to be entrapped in the ice at the bottom of
the ice sheet (e.g., Malmgren and Sverdrup 1927,
brine volume) gradually decreases. This is due to
Burke 1940, Zubov 1945, Weeks and Lee 1958,
brine pockets intercepting the drainage network
Nakawo and Sinha 1981) and for congelation ice
and draining to the sea in advance of the follow-
the ice platelets that form each ice crystal are
ing brine wave. This drainage phenomenon, il-
narrower (e.g., Weeks and Hamilton 1962a,b; Page
lustrated in terms of a very smooth ice sheet sa-
1966; Nakawo and Sinha 1984). As the ice sheet
thickens, the rate of growth slows due to the de-
linity distribution profile, is shown in Figure 5.
creasing rate at which heat is transferred from the
The salinity (brine) migration wave shown is very
bottom of the ice to the atmosphere (Makshtas
fast, about 0.8 cm/day. Migration rates one to two
1984, Maykut 1986). This heat exchange is further
orders of magnitude lower may be more typical
reduced with increasing snow cover. The net ef-
for winter sea ice, based on the velocity assess-
fect is that less brine entrapment occurs as the ice
ments presented by Weeks and Ackley (1989), who
increases in thickness. Over time, very gradual
give an in-depth review of sea-ice salinity and
brine migration occurs toward the warmer sea-
brine entrapment and migration processes. In ad-
water (Whitman 1926, Zubov 1945, Kingery and
dition, it is difficult, at best, to see this movement
Goodnow 1963, Bennington 1967, Untersteiner
in the similar data of Nakawo and Sinha (1981),
1968, Nakawo and Sinha 1981). An explanation
and a rate of 1 mm/day may be estimated from
for this continued brine migration is the dissolu-
Shapiro and Weeks (1993, Figure 9).
tion of ice by the brine at the warmer bottom end
A widely cited study on the bulk salinity varia-
of a brine pocket and a refreezing of water at the
tion in sea ice is that of Cox and Weeks (1974). In
colder upper end of the pocket. This migration
this study average or bulk salinity data for winter
and associated brine drainage gradually reduce
Beaufort Sea ice was collected from a number of
the bulk salinity of the ice from an initial value of
sources. Their plot of the salinity vs. ice thickness
as much as 25‰ for ice 5 cm thick to about 5‰
data clearly shows a decrease in bulk salinity with
for first-year ice about 2 m thick.
increasing ice floe thickness (Fig. 6). The available
Accelerated brine drainage can occur under
data seemed to justify representing the bulk sa-
warming conditions. The enriched brine from the
linity vs. ice floe thickness trend by the two linear
top of the ice sheet can move downward like a
curves shown in Figure 6. However, many natu-
wave slowly descending through the ice sheet.
ral phenomena tend to follow exponential-like
During the descent the general form of the wave-
distributions. Sea-ice bulk salinity vs. floe thick-
let is preserved, but the amplitude (that is, the
ness appears to be one of them.
4


 Previous Page
