and
TCAug = 1.0258 MF + 7,843
TCAug = (,450 13.601 days) + MF,
and the corresponding r2 statistic is 0.9977. The
change in total cost is 1.03 times the change in the
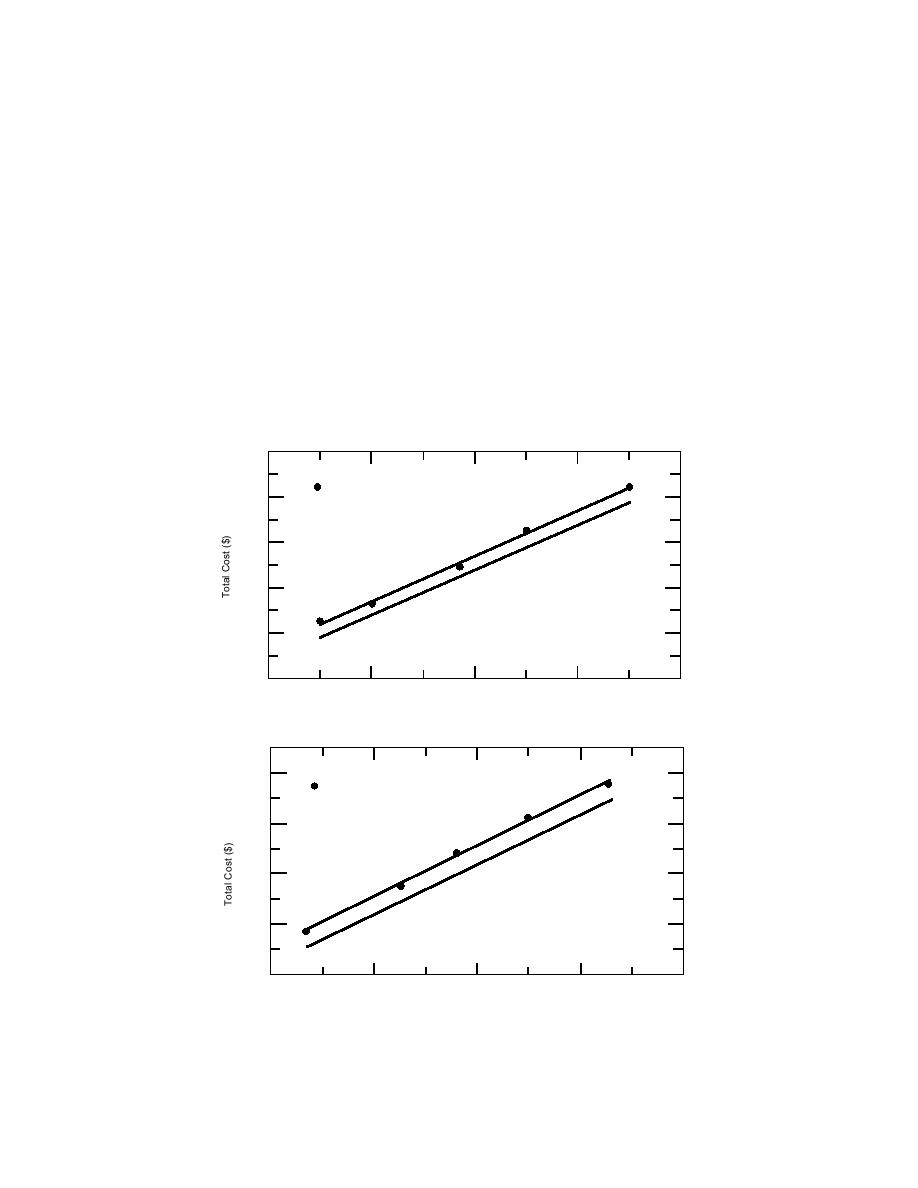
and the results of varying MF are presented in
fixed fee. The differences between the simple equa-
Figure 15 and Table 19. The least-squares linear fit
tion predictions and the numerical results are
to the modeled results was
slightly but insignificantly greater than those cal-
culated for April.
TCApr = 1.0177 MF + 1,317
Final simulations
with an r2 statistic of 0.9966. The slope shows that
The final simulations were run using the costs
for every
||content||
change in the fixed voyage fee there is
scenario discussed above under The Transit Model.
a resulting
||content||
.02 change in the total cost of transit.
That is,
Again, the difference values in column D show
Cargo ship costs ($/day):
that the simple equation insignificantly under-
predicts the numerical model.
Noril'sk-class
=
16,450
For August transits, the linear fit to the numeri-
Lunni-class
=
16,775
cally modeled results is
Strekalovsky-class
=
10,200
580 x 103
Modeled Results
560
Linear
540
Fit
Eq. 5
520
500
480
180 x 10 3
100
120
140
160
Miscellaneous Fees ($/voyage)
a. April transits.
380 x 103
Modeled Results
360
Linear
Fit
Eq. 5
340
320
300
160 x 10 3
80
100
120
140
Miscellaneous Fees ($/voyage)
b. August transits.
Figure 15. The effect of miscellaneous fees on total shipping costs.
41


 Previous Page
