Table 8. Water quality measurements and vegetation at sites in Area C where
sediment temperatures and moisture levels were monitored and white phos-
phorus particles incubated, MayAugust, 1994.
Water quality (May 1994)
Depth
Cond.
Redox
Site
(cm) (mmho/cm) (mvolts)
pH
Vegetation (August 1994)
1
12
17.1
177
7.7
Mare's tail (Hippurus tetraphylla)
2
8
17.6
169
8.3
Unvegetated
3
4.5
18.6
182
8.5
1% arrowgrass (Triglochin maritima) seedlings
4
2
24
111
8.6
1% glasswort (Salicornia europea)
5
1
24
55
8.7
1% glasswort, arrowgrass seedlings
6
0
Alkali grass (Puccinelia hultenii), arrowgrass
7
0
Alkali grass, arrowgrass, 40% bare ground
8
0
Goose tongue (Plantago maritima), alkali grass,
arrowgrass, kenipod (Atriplex gmelini),
cinquefoil (Potentilla egedii), 20% bare ground
9
0
Beach rye (Elymus arenarius), cinquefoil
10
0
Goose tongue, beach rye (40%), cinquefoil
FPO
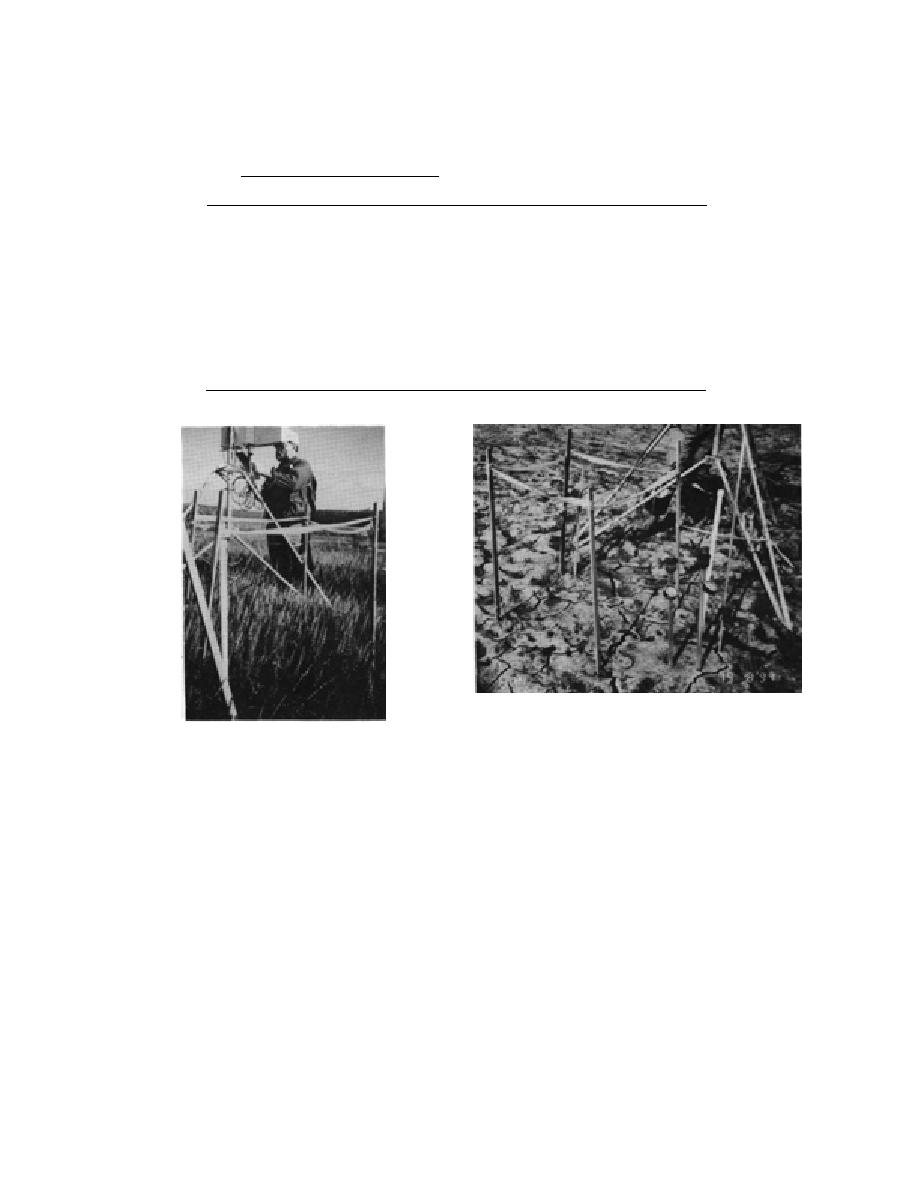
Figure 20. Site in an intermittent pond in August.
The surface is cracked and covered with precipitated salt.
Figure 19. Permanently flooded site (site 1)
A few glasswort and arrowgrass seedlings punctuate the
with a dense stand of Hippurus tetragona.
mostly bare sediment.
to the river levee (site 8) with the addition of
thaw cycles, earthquakes, wetdry cycles etc. Ten-
goose tongue, kenipod and cinquefoil to the
siometer and moisture probe resistance measure-
stand of alkali grass and arrowgrass. The two
ments were plotted vs. moisture content for
depths of 10 and 25 cm (Fig. 23) to determine the
river levee sites were densely vegetated with a
tall stand of beach rye (Fig. 22).
moisture contents for saturation for undisturbed
Gravimetric moisture content measurements
sediments under field conditions. Both measure-
were obtained in May (Table 9) while sediments
ments indicate saturation for sediments with
were saturated at the pond and mudflat sites.
moisture contents above 40% (dry weight basis) at
10 cm and above 35% at 25 cm. These moisture
River levee sediments did not appear to be satu-
contents are lower than that determined for the
rated when sampled. Samples were taken again
homogenized sediment in the laboratory, most
in June just prior to a flooding high tide, then
likely due to consolidation in the field.
again in August. At the two later sampling times,
the moisture contents were less than in May at all
The highest temperatures were measured at a
sites except the permanently flooded site. The dry
depth of 5 cm, and temperatures at 10 cm were
bulk density generally increased with depth,
only slightly less than at 5 cm (Fig. 24). The aver-
mostly likely due to consolidation from freeze
age temperatures at 5 cm deep were between 16
18


 Previous Page
