40
1.0
1.0
35
10 cm Depth
25 cm Average Depth
Tension
Tension
30
0.8
0.8
30
25
0.6
0.6
20
20
15
0.4
0.4
10
10
0.2
0.2
5
0
0
0
0
0.25
0.30
0.35
0.40
0.45
0.50
0.25
0.30
0.35
0.40
0.45
0.50
Moisture Content (dry weight basis)
Moisture Content (dry weight basis)
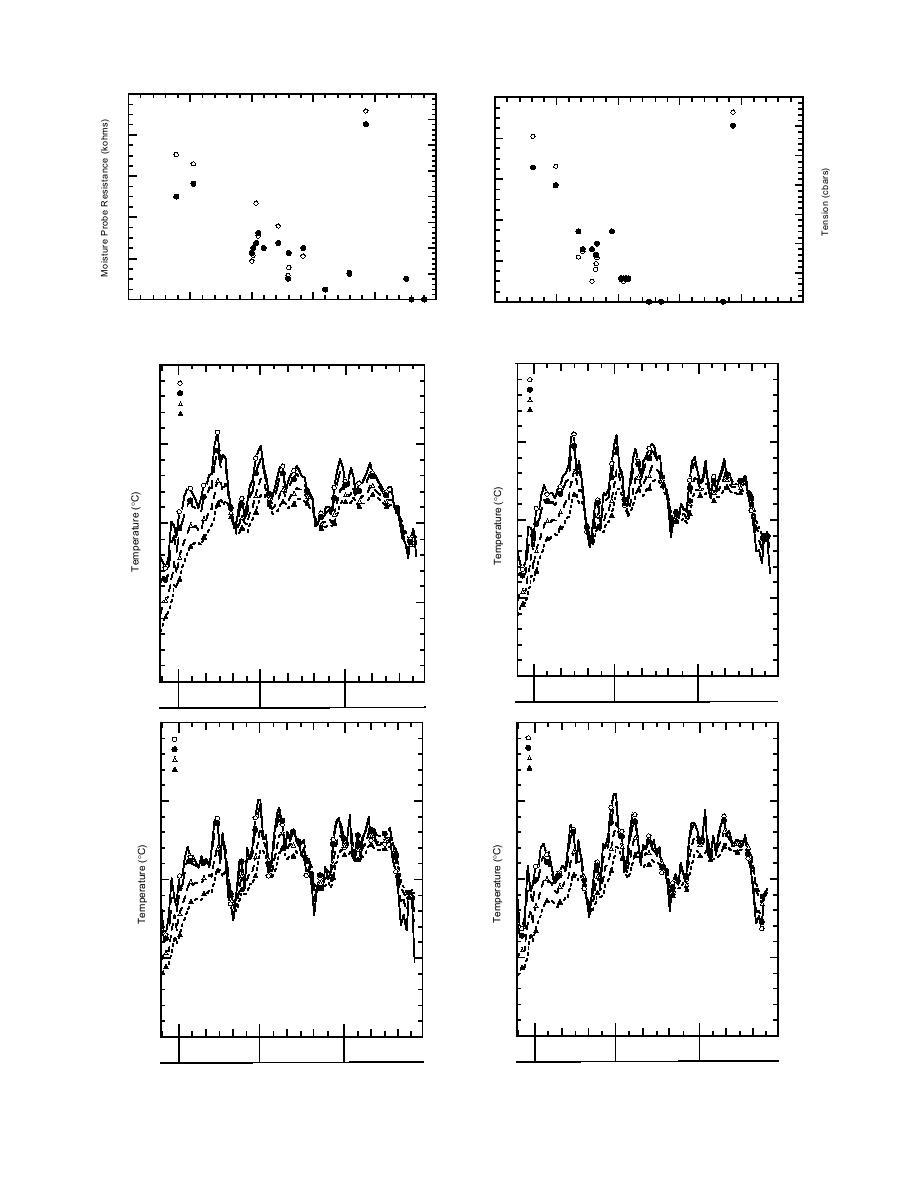
Figure 23. Moisture probe resistance and tensiometer readings obtained along the transect in Area C.
25
25
5 cm
5 cm
10 cm
10 cm
20 cm
20 cm
30 cm
30 cm
20
20
15
15
10
10
b. Site 2--Intermittent pond.
a. Site 1--Permanently flooded.
5
5
10
20
10
20
10
20
25
25
10
20
10
20
10
20
May
Jun
Jul
Aug
May
Jun
Jul
Aug
25
25
5 cm
5 cm
10 cm
10 cm
20 cm
20 cm
30 cm
30 cm
20
20
15
15
10
10
c. Site 3--Intermittent pond.
d. Site 4--Intermittent pond.
5
5
25
10
20
10
20
10
20
25
10
20
10 20
10
20
May
Jun
Jul
Aug
May
Jun
Jul
Aug
Figure 24. Daily (24-hour average) temperatures at 5, 10, 20 and 30 cm deep at each site.
20


 Previous Page
