N
Upland
0
200 m
Not Detected
Permanent Ponds
< 0.001 mg/kg
0.001-0.099
Intermittent Ponds
0.1-9.99
Drainage Gullies
> 10
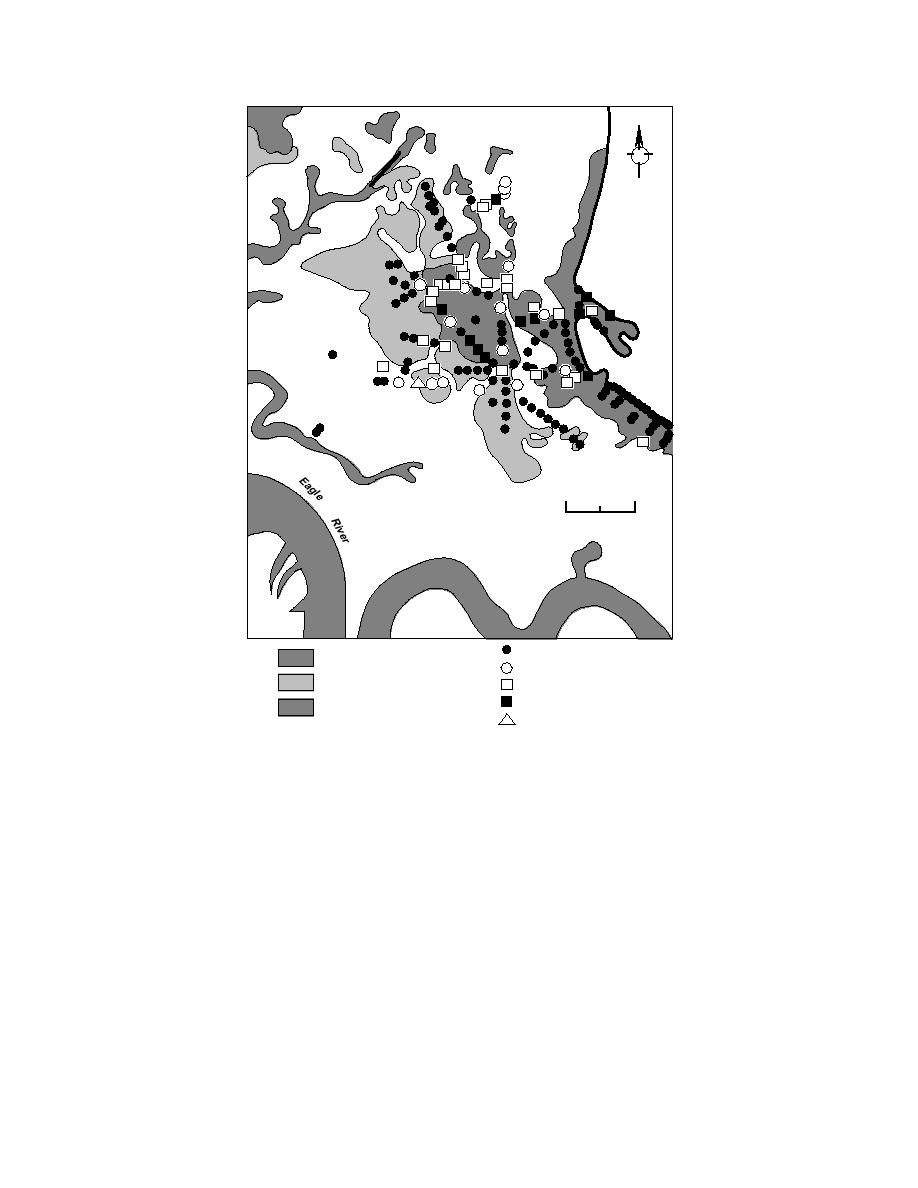
Figure 14. Sampling locations in Area C and results of sediment analyses for white phosphorus.
moisture and temperature at ten sites along the
Results
eastwest transect (Fig. 15, 16 and 17) were moni-
tored to see if conditions are conducive to natural
ter in the ponded sites increased towards the
west (towards the river) (Table 8). The water at
Universal Transverse Mercator coordinates and
each site was slightly alkaline, and reducing con-
elevations for the ten study sites in Area C are giv-
ditions (i.e. low redox potentials) were found in
en in Table 7. The overall length of the transect
the sediments at each site.
was 636 m, with a total elevation change of 0.52 m
Vegetation varied significantly between sites
(Fig. 16). Water quality measurements were made
(Table 8). The permanently flooded site (site 1)
in May when the ponds were full (Fig. 18), and
had a dense stand of mare's tail (Hippurus tetra-
vegetation was recorded in August (Fig. 18).
gona) (Fig. 19). The intermittent pond sites (sites
In addition, P4 particles, produced in the labo-
25) were mostly bare, with a few arrowgrass
ratory as described above, were planted at each
seedlings and glasswort (Fig. 20). Mudflat sites
site and recovered at the end of the summer to see
(6 and 7) were sparsely vegetated with alkali
if the mass of the P4 particles decreased. Details of
grass and arrowgrass (Fig. 21). The density of
the procedures used are given in Appendix B.
vegetation was higher at the mudflat site closest
15


 Previous Page
