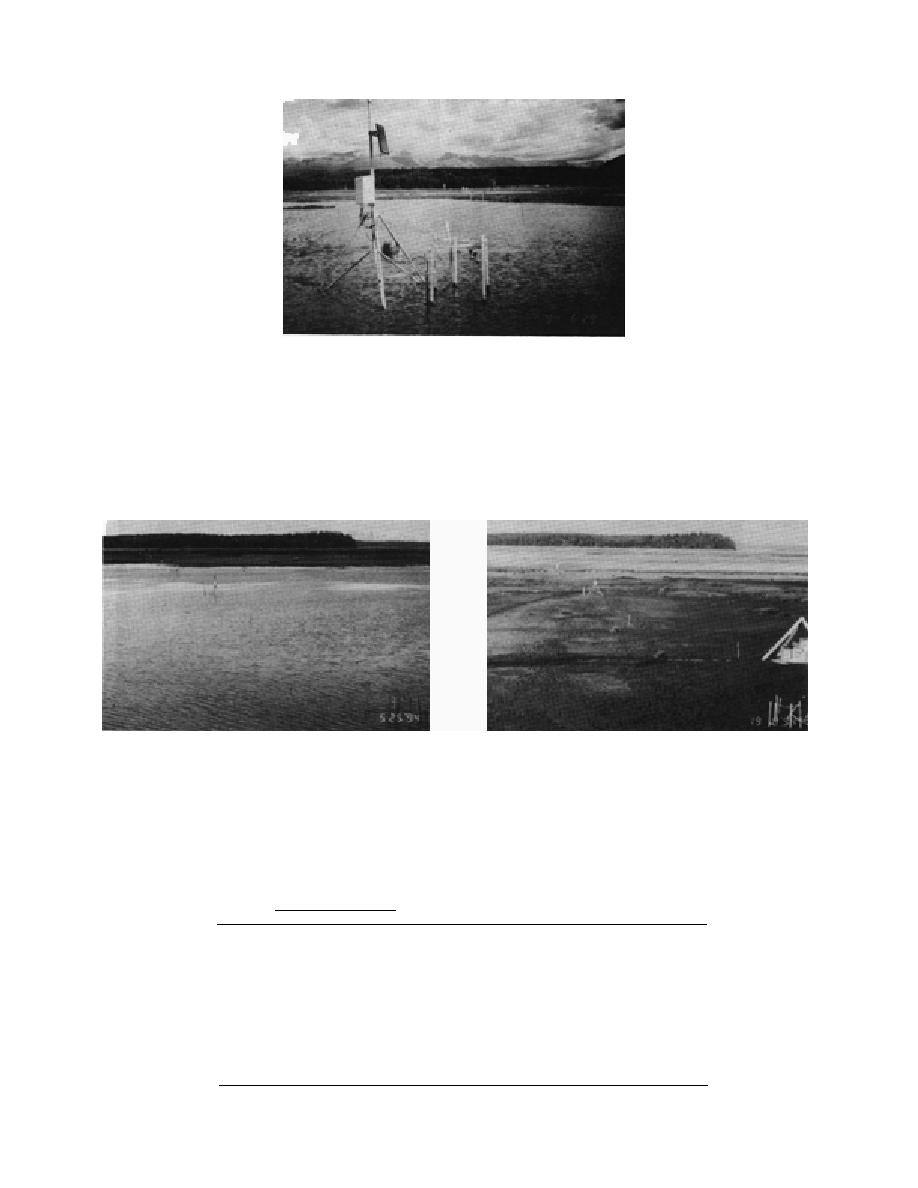
Figure 17. Study site in an intermittent pond area show-
ing the datalogger with a solar panel mounted on a tri-
pod. Data for sediment moisture and temperature were re-
corded every 10 minutes and averaged hourly from May 25
to August 26. Lath surrounds area where P4 particles were
planted. Tensiometers and the piezometer are also visible.
a. May.
b. August.
Figure 18. View looking west along transect across an intermittent pond area.
Table 7. UTM coordinates and elevations of sites in Area C where sediment
temperatures and moisture levels were monitored and white phosphorus
particles incubated, MayAugust, 1994.
Distance
Elev. change
UTM coordinates
between
Elev.
between
Field site
Easting
Northing
sites (m)
(m)
sites (m)
Site descriptor
1
355,171.6
6,801,180.4
4.70
Permanently saturated
2
355,105.8
6,801,192.5
66.9
4.74
0.04
Intermittent pond area
3
355,013.4
6,801,197.7
92.5
4.78
0.04
Intermittent pond area
4
354,917.7
6,801,208.1
96.3
4.80
0.02
Intermittent pond area
5
354,893.5
6,801,212.1
24.5
4.85
0.05
Intermittent pond area
6
354,836.9
6,801,216.9
56.8
4.87
0.02
Mudflat
7
354,713.4
6,801,230.2
124.2
4.92
0.05
Mudflat
8
354,593.0
6,801,243.0
121.1
4.99
0.07
Mudflat
9
354,553.3
6,801,247.3
39.9
5.06
0.07
River levee
10
354,539.1
6,801,248.7
14.3
5.22
0.16
River levee
17


 Previous Page
