0.9
0.8
0.7
0.6
0.5
0.4
0.3
24 (C-days)
4
8
12
16
20
0
40 (F-days)
0
8
16
24
32
Weighted Average of Degree Days
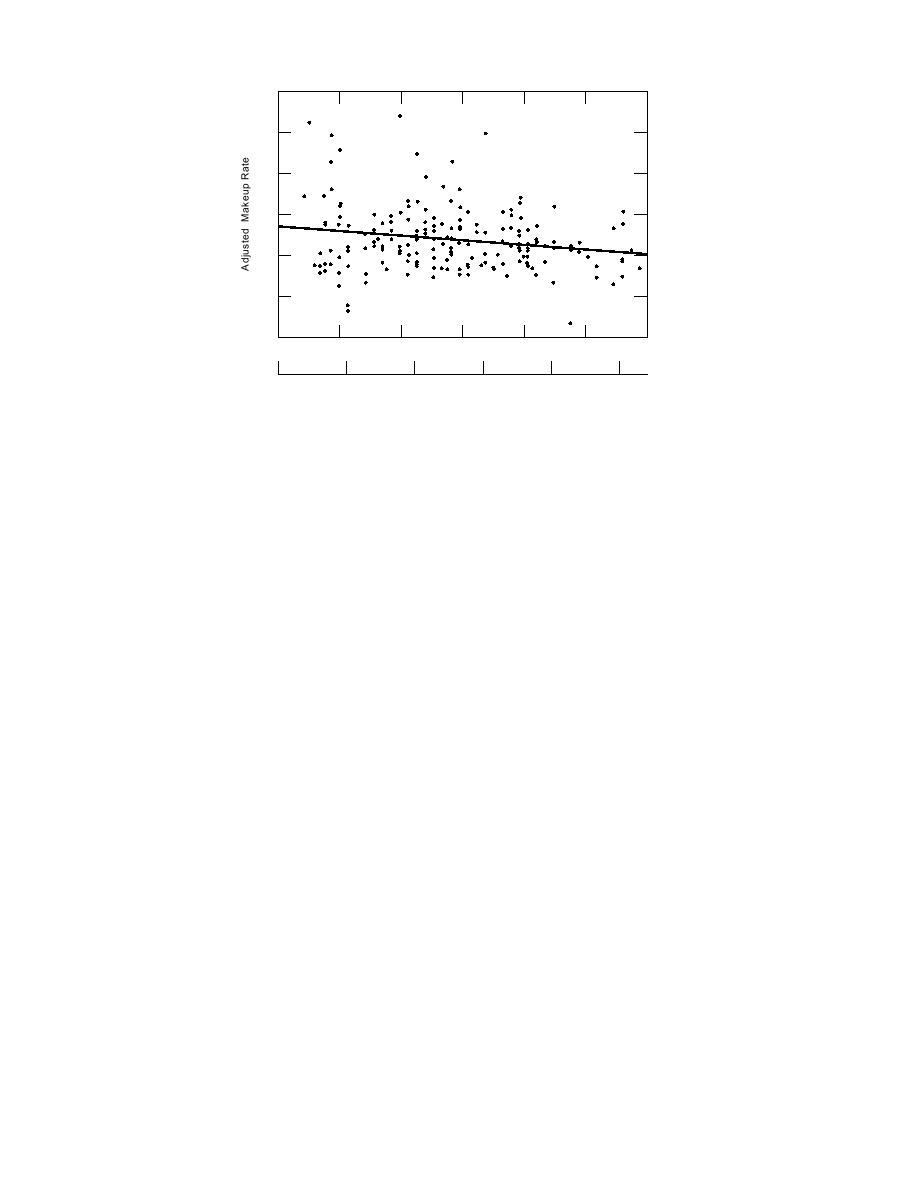
Figure 4. Adjusted makeup rate as a function of degree days.
the slope of the regressed function. It is fairly cer-
function has also been regressed onto these data.
The r2 for this regressed function is only 3.7%, how-
tain, however, that most of the variable portion must
be due to the condensate return system or lack
ever, so it cannot be considered statistically signifi-
thereof. Since leaks in the steam supply piping and
cant. The average of all the adjusted makeup rate
terminal equipment were not prevalent during site
data for the entire study period is 54%.
visits, most of the fixed portion of the leakage can
also be assumed to be in the form of condensate.
Conclusions regarding the
Since the condensate has a much lower enthalpy
Hawthorne AAP steam system
than the steam, on a unit mass basis, the condensate
With limited data we have constructed some
leaks are of much less consequence than steam leaks
estimates of the thermal and mass losses from the
would be. If we assume that all the mass loss is in
Hawthorne AAP steam heat distribution system.
the form of condensate, the equivalent energy loss
These estimates indicate that losses from the system
would be the difference between the enthalpy of the
are very high. Our estimates indicate that only 43%
condensate and that of the makeup water multiplied
of the steam leaving the plant is ultimately used for
by the total mass loss from the system over the
required space heating. The remainder (57%) is con-
study period. From the regression equation the total
sumed in steam and condensate leaks, heat losses,
mass loss is found to be 9,601,000 kg (21,234,000
and unnecessary overheating of buildings due to
lbm) and the enthalpy difference is 255.6 KJ/kg
poor control. Most of these losses would be drasti-
(109.9 Btu/lbm), so that the total equivalent energy
cally reduced if a low temperature hot water heat
loss from this mass leakage is 2,450 GJ (2,334 MBtu)
distribution system were retrofitted to Hawthorne
for the study period. If 10% of the mass loss were to
AAP. For example, Werner (1984) reports the heat
be in the form of steam the equivalent energy loss
losses from six Swedish low temperature hot water
would be nearly double at 4,820 GJ (4,588 MBtu).
heating systems as ranging from 4.9% to 7.7% of the
The most common measure of distribution sys-
total heat production, with the average being 6.6%.
tem leakage is the makeup rate, as discussed earlier.
It is also clear from Werner's (1984) data that the
We have adjusted the makeup rate by subtracting
heating load drops to 10%, or less, of its maximum
the makeup flow required for boiler blowdown.
value during times of low load. Since this includes
This yields a more representative picture of the mass
domestic tap water heating as well as distribution
system heat losses, it is apparent that control of the
losses in the distribution system and terminal equip-
building heating systems on a low temperature hot
ment. Figure 4 shows the adjusted makeup rate as a
function of the weighted average degree days accu-
water system must be much more effective than on
mulated for each day of the study period. A linear
the Hawthorne AAP steam system. Based on the
11


 Previous Page
