heated to about 21C (70F) the base temperature
late the remaining quantities. This information was
for the degree day calculation is taken as 18.3C
then transferred to a commercially available statisti-
(65F). For other types of buildings that are not
cal/graphical software package where the remain-
heated to as high a level, lower base temperatures
ing analysis was performed.
can be used. The portion of Hawthorne AAP un-
The first set of results we will present is intended
der study had residential and office buildings that
to enforce the premise that the heating degree day
would normally be heated to about 21C (70F) as
data provides a reasonable representation of the
well as shop type buildings that would not be
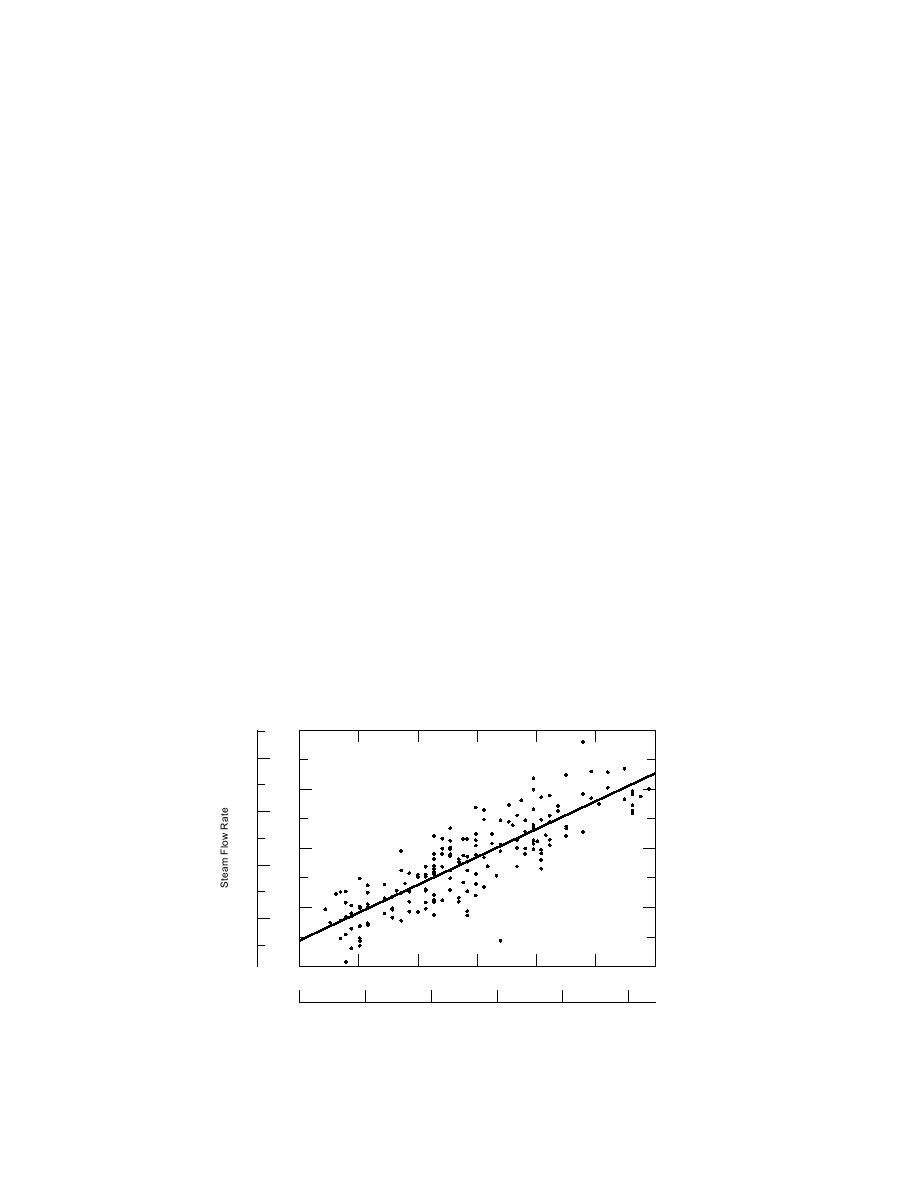
heat load from the buildings. Figure 2 shows the
heated to as high a level. In order to more accu-
average steam flow rate from the plant as a function
rately model the energy use of the shop build-
of the weighted average of the heating degree-day
ings, a base temperature of 12.8C (55F) was used
data. Although there is considerable scatter in these
for these buildings. The degree days were calcu-
data, they clearly support the concept of the degree
day. The r2 value for the linear relationship that was
lated on a daily basis for each of the two base
temperatures. These were then combined by form-
fitted to the data is 72%. Since this is the total steam
ing a weighted average of the two degree-day
flow from the plant, it represents all the losses from
figures obtained. The weighting factors used were
the system that would be manifested by steam con-
determined by taking the relative fraction of total
sumption as well as all energy consumption at the
floor area comprised by each building type. The
buildings. The components that make up the total
floor area of the residential and office buildings
steam flow out of the plant are the following:
comprised 63.2% of the total heated floor area
and the remaining 36.8% was from shop build-
1. Leaks from the steam piping into the envi-
ings. For the month of December 1987 the degree
ronment.
days computed for each of the two base tempera-
2. Heat losses from the steam lines that cause
tures, as well as the weighted average, are pre-
the saturated steam to condense. The con-
sented in Table 1.
densate is then subsequently drained from
the steam pipe and passes through a steam
trap into the condensate return system.
Results for the Hawthorne system
For each of the 181 days of the continuous
3. The heating load in the building that causes
period of boiler operation in the 1987/88 heating
steam to be condensed to meet this load.
Then the condensate passes through steam
season, the quantities in Table 1 were either mea-
traps into the condensate return system. Dur-
sured or calculated based on formulas presented
ing the time period when our data were
in Phetteplace (1991a). The measured data were
collected, no steam was used for domestic
input manually into a commercially available
tapwater heating.
spreadsheet program, which was used to calcu-
(lbm/s)
(kg /s)
2.0
4.0
1.6
3.2
1.2
2.4
0.8
1.6
0.4
24 (C - days)
0
4
8
12
16
20
40 (F - days)
0
8
16
24
32
Weighted Average of Degree Days
Figure 2. Steam flow from the plant as a function of degree days.
7


 Previous Page
