(lblb /ss) (kg /s)
( m/ )
1.0
2.0
0.8
1.6
0.6
1.2
0.4
0.8
0.2
24 (C - days)
0
4
8
12
16
20
40 (F - days)
0
8
16
24
32
Weighted Average of Degree Days
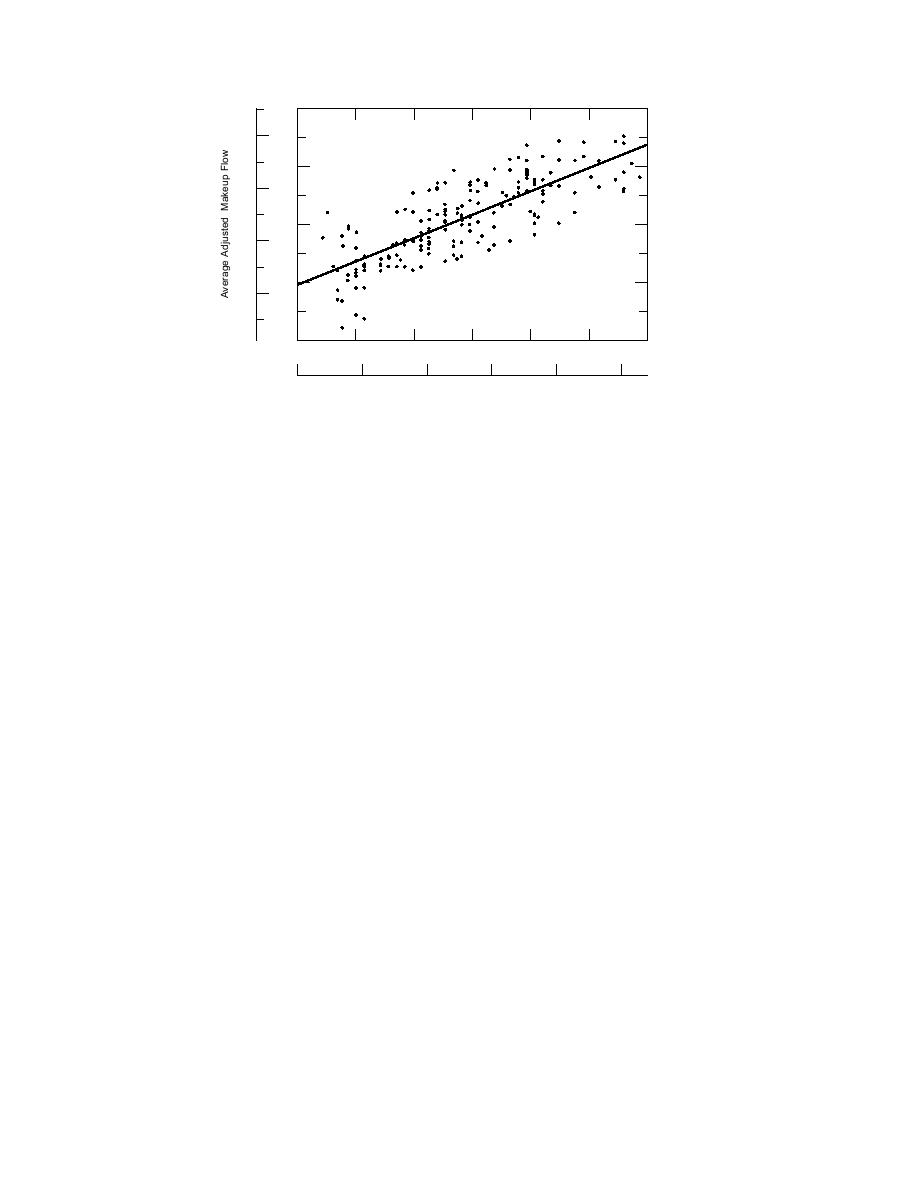
Figure 3. Adjusted average makeup flow rate as a function of degree days.
to heat losses and leaks as well as that unneces-
3. Condensate discarded at the consumers due
sarily used for building heating due to inadequate
to lack of a condensate return system.
control. This remaining quantity is found by mul-
4. Condensate leaks from the condensate re-
tiplying the intercept of the regressed line by the
turn system.
length of the period of the heating season under
study (181 days), the result being 10,368,000 kg
The first two sources of leaks listed, those in the
(22,832,000 lbm). Thus the total steam supplied was
steam supply line and the consumer's equipment,
18,159,000 kg (40,008,000 lbm). The distribution effi-
will be primarily functions of pressure and thus
ciency, that is the useful steam delivered divided by
fairly independent of heating load. To some extent
the total steam leaving the plant, is 42.9%.
this is also true of the leaks from the condensate
The amount of water which must be added to
return system. This system operates by gravity in
the system to account for that lost is called the
most places. The condensate return piping is in poor
makeup. The amount of makeup water is another
condition in many places, however, and larger flow
important measure of the efficiency of a heat distri-
rates can result in slightly higher pressures or more
bution system. Figure 3 shows the average makeup
completely filled pipes in cases where the pipes are
water flow rate as a function of the weighted aver-
not always flowing full. Thus, higher rates of leak-
age degree days accumulated for each of the 181
age could accompany the increased flow resulting
days in the study period. This makeup water flow
from higher heating loads. The remaining source of
rate has been adjusted to be more representative of
condensate loss, discarding at the consumer, will be
that due to losses in the distribution system and
highly dependent on heat load. With the exception
terminal equipment by subtracting the flow rate of
of the portion of the heat load that results from
water used in boiler blowdowns. Boiler blowdown
excessive building heating due to inadequate con-
is the term used to describe the periodic discharge
trol, all of the condensate loss from this source will
of water from the bottom of the boiler. This water is
be proportional to the load. A linear function has
discharged because it becomes high in contaminants
been regressed onto the data of Figure 3. The in-
as the pure water is boiled off.
tercept of this linear function is 0.390 kg/s (0.860
lbm/s) and its slope is 0.020 kg/s-C-day (0.0247
Mass losses in the distribution system and ter-
lbm/s-F-day). In this case it is more difficult to
minal equipment occur in the following areas:
determine what sources are responsible for the
1. Steam leaks from the steam supply piping.
"fixed" losses represented by the intercept portion
2. Steam and condensate leaks at the heat con-
of the regressed function and what sources are re-
sumer's terminal equipment.
sponsible for the "variable" losses represented by
10


 Previous Page
