sponds to the center of the inclusion, the inclu-
course of a northern New England winter, makes
sion can be more than 4C colder (Fig. 9b). Over
it difficult to examine the significance of factors
the course of the winter, the trend and magni-
such as the moisture content of the soil or the se-
tude of the temperature differences are largely
verity of the weather. Instead, the boundary con-
independent of whether the inclusion is sand or
ditions designated cold, warm and warmest will
sandy soil. During an early freezing episode fol-
be used for simulating heat flow in silty soil with
lowing a surface thaw (for example, days 56 to
a moisture content of 10, 17 or 25%, and in inclu-
64), however, both inclusions respond more rap-
sions of sand or sandy soil.
idly to the cold wave. Other things being equal,
the lower thermal conductivity of the inclusion
1. BC-Warmest
would act to retard the influence of boundary
Under this mildest winter condition, expressed
temperature changes. More importantly, howev-
as both a shorter duration of below-freezing soil
er, the lower heat capacities and lower latent
surface temperatures and as warmer surface tem-
heats of the dryer sandy materials promote more
peratures, frost penetration is confined to the up-
rapid freezing than in the soil because a smaller
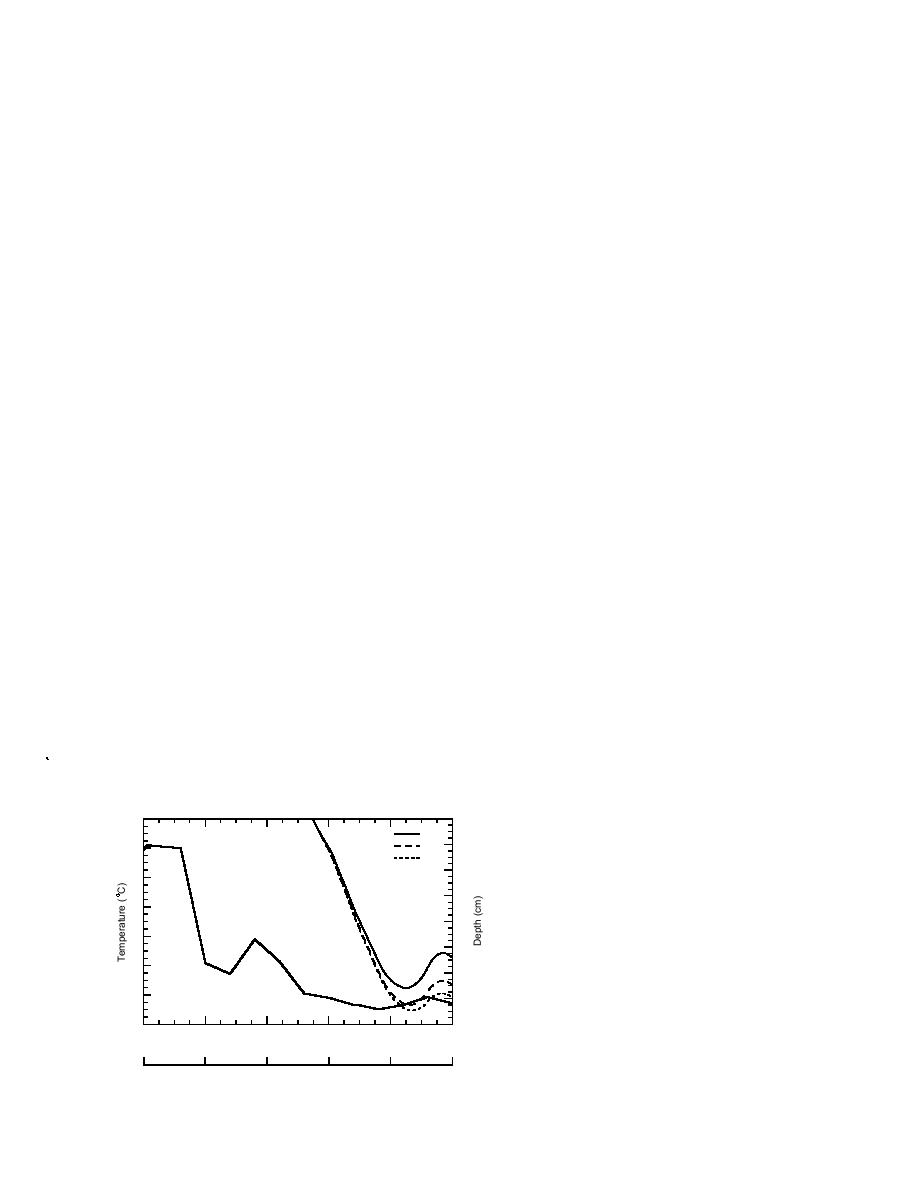
per 15 cm of the soil. Figure 10 shows the depth
change in thermal energy is required to lower
of the freezing front in soil (no sand inclusion)
the temperature of or to freeze the sandy materi-
through day 100. Three moisture contents of the
als. For these materials, a smaller loss of heat in
soil are represented. Surface thawing begins
response to a cold wave is sufficient to change
shortly after this (day 101), and the thickness of
the temperature of the inclusion material (heat
the frozen layer decreases under the joint action
capacity) or to change its phase (latent heat).
of warming from below and from the surface. The
Also, since the less conductive inclusion dimin-
soil is completely unfrozen (Table 3) by day 103
ishes upward heat flow, that upward flow is less
(10% and 17% moisture contents) or day 105 (25%
able to mitigate the near-surface effects of the
moisture content).
cold wave.
Frost penetration is deeper in moister soil, be-
When both the soil and the inclusion material
ing 13, 14 or 15 cm in 10, 17 or 25% moisture con-
are frozen, the inclusion material is warmer
tent soil, respectively (Table 3). This is a conse-
(positive temperature difference) during extend-
quence of the differences in thermal conductivity
ed periods when the soil surface temperature is
of the frozen soils (Table 1). The thermal conduc-
less than 0C, such as days ∼7278 and ∼8692.
tivity increases 57% due to a rise in soil moisture
The higher thermal conductivity of the frozen
content from 10 to 17%, and 36% upon a further
soil, twice that of either frozen sand or frozen
rise in soil moisture content to 25%. Although the
sandy soil, promotes more rapid cooling of the
latent heat of the soil increases with moisture con-
soil.
tent, so that to freeze a unit volume of soil re-
The complexity of the time series record of
quires the release of more energy the more moist
soil temperatures resulting from BC1 surface
the soil is, once the soil is frozen, it conducts heat
temperatures, although a realistic representation
from the freezing front more readily when moist.
of the potential variation in frost depth over the
The removal of the pulse of heat released upon a
0
12
10%
2
17%
10
25%
4
8
6
6
8
4
10
2
12
Figure 10. Location of the freezing front in silty
Surface Temperature
0
14
soil of 10, 17 or 25% moisture content, with no
inclusion present, as determined with one-dimen-
16
-2
0
20
40
60
80
100
sional numerical simulations under BC-Warmest
Day (11 Nov is day 1)
conditions. The imposed temperature history of the
soil surface is also shown.
10 Nov
30 Nov
20 Dec
9 Jan
29 Jan
18 Feb
11


 Previous Page
