17%
0
25%
10
10
8
2
20
20
4
4
30
30
6
0
8
40
40
Surface Temperature
10
4
50
50
No Sand
0
40
80
120
160
0
40
80
120
160
12
Sand
Day (22 Oct is day 1)
14
100 1 Oct
30 Nov
9 Jan
18 Feb
30 March
0
20
40
60
80
Day (11 Nov is day 1)
10 Nov
30 Nov
20 Dec
9 Jan
29 Jan
18 Feb
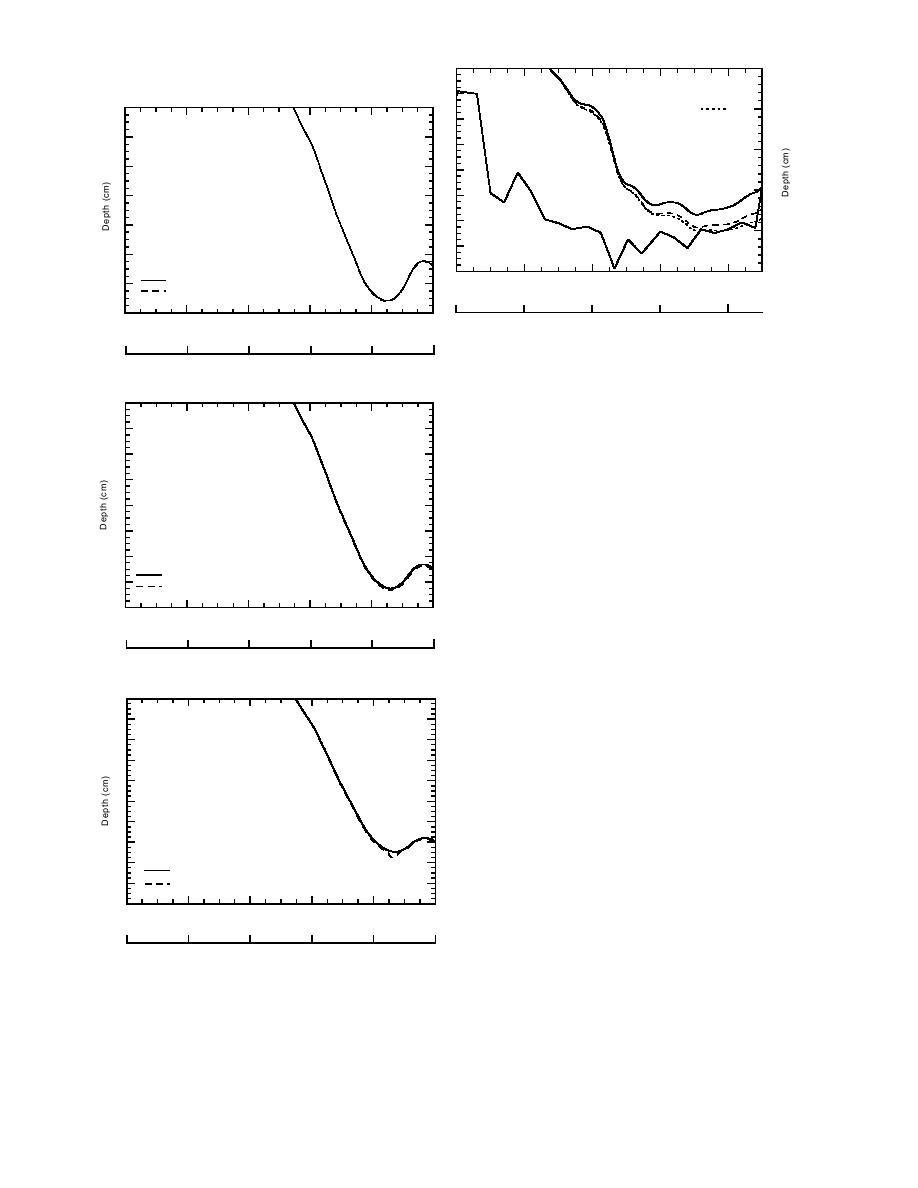
Figure 12. Location of the freezing front in silty soil
a. 10% moisture content.
of 10, 17 or 25% moisture content, with no inclusion
0
present, as determined with one-dimensional numeri-
2
cal simulations under BC-Warm conditions. The im-
posed temperature history of the soil surface is also
4
shown.
6
8
face is experiencing an overall warming trend.
The brief cooling episodes that follow are super-
10
imposed on the longer-term warming trend. The
12
higher surface temperatures effectively reduce
No Sand
the driving force for further reductions in soil
14
Sand
temperature at depth. Frost penetration contin-
16
ues at a reduced rate in the soil, until approxi-
0
20
40
60
80
100
Day (11 Nov is day 1)
mately day 142. Thawing from the surface down
begins late on day 176. The soil is fully thawed
10 Nov
30 Nov
20 Dec
9 Jan
29 Jan
18 Feb
by day 184 (10% moisture content), 185 (17%
b. 17% moisture content.
moisture content) or day 186 (25% moisture con-
0
tent).
Given that when there is no sand inclusion
4
the frost depth reaches at least 30 cm for all three
soil moisture contents, which is a highly favor-
able situation for an electromagnetic sensor sys-
8
tem, it is particularly important to know what
differences in frost penetration result because a
12
sand inclusion is present. Accordingly, simula-
tions were done to investigate the effect of a
16
sand inclusion on frost and thaw penetration for
No Sand
Sand
this boundary condition. The freezing histories
20
are identical, for the sand inclusion and no in-
0
20
40
60
80
100
clusion cases, until the freezing front encounters
Day (11 Nov is day 1)
the sand inclusion (Fig. 13). Frost penetration
10 Nov
30 Nov
20 Dec
9 Jan
29 Jan
18 Feb
proceeds more rapidly through the relatively
c. 25% moisture content.
dry sand than it does through the soil, reaching
a depth of 30 cm 12, 9 or 8 days sooner when a
Figure 11. Comparison of the location of the freezing
sand inclusion is present, for soil moisture con-
front in silty soil with and without a sand inclusion
tents of 10, 17 or 25%, respectively. Differences
present, as determined with one-dimensional numerical
in latent heat and heat capacity between the soil
simulations under BC-Warmest conditions.
and sand determine the relative rates of advance
13


 Previous Page
