0
12
No Sand
5
10
Sand
Sandy Soil
10
8
15
6
20
4
25
2
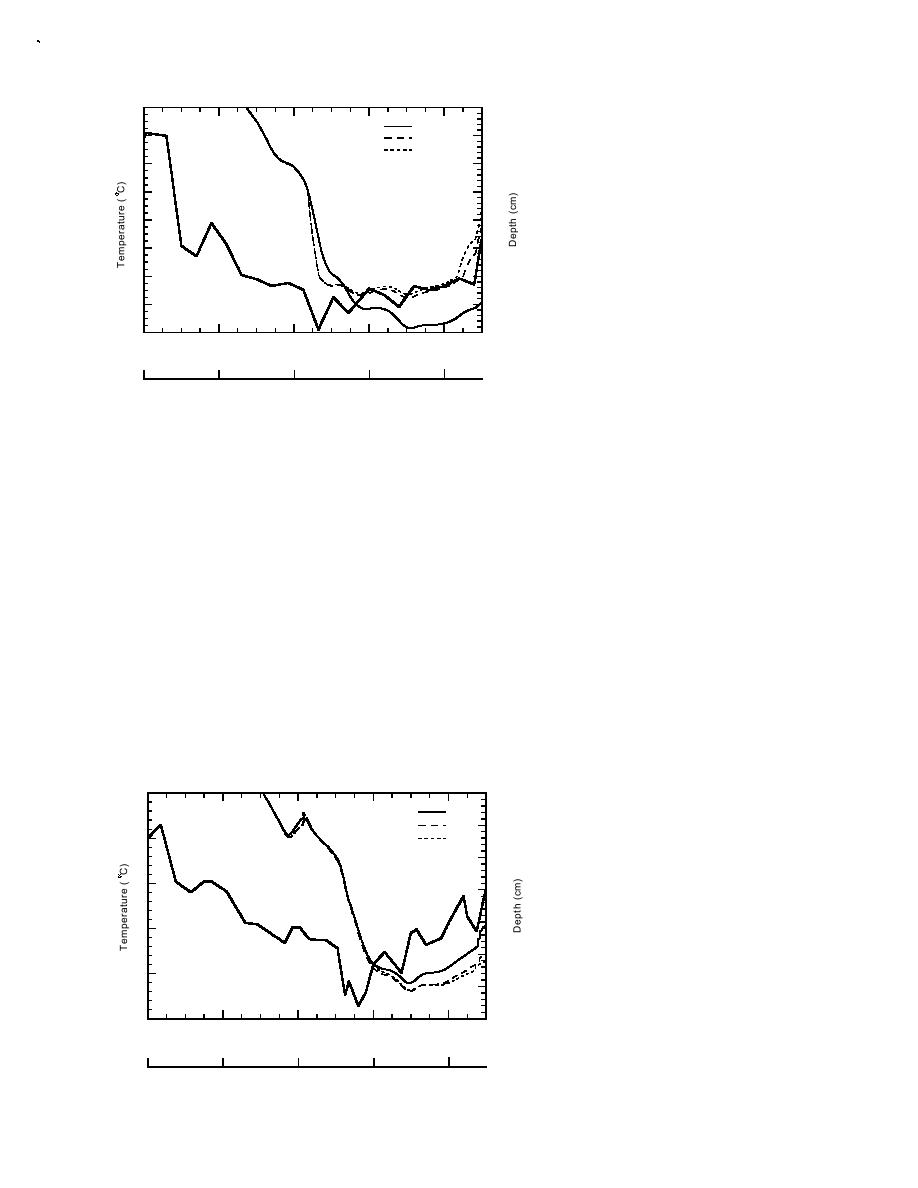
Figure 15. Comparison of freezing front loca-
30
0
tions in silty soil (17% moisture content) for
Surface Temperature
35
-2
the cases of no inclusion, an inclusion of sand
and an inclusion of sandy soil, as determined
40
-4
0
40
80
120
160
with one-dimensional numerical simulations
Day (22 Oct is day 1)
under BC-Warm conditions. The imposed tem-
perature history of the soil surface is also shown.
21 Oct
30 Nov
9 Jan
18 Feb
30 March
tion that, under BC1 conditions in early winter,
Frost penetration also varies with the moisture
soil above an inclusion is colder (warmer) when
content of the soil, with least penetration in 10%
the inclusion material is sand (sandy soil), the
moisture content soil, as previously noted for
more rapid thawing associated with a sandy soil
soil with no sand inclusion.
inclusion suggests that sand, rather than sandy
There is a transient surface thaw during days
soil, is the preferred material for surrounding
76 to 82. The 17% and 25% moisture content
the sensor cables.
soils thaw completely. The thaw penetrates 4.5
cm into the 10% moisture content soil, leaving a
3. BC-Cold
4-cm-thick frozen layer below the thawed layer.
The final round of one-dimensional simula-
End-of-winter thawing from the surface down
tions was conducted with a boundary condition
begins on day 158. The 25% moisture content
representative of the most severe winter condi-
soil is completely thawed on day 186, the 17%
tions considered. Equivalently, it corresponds to
moisture content soil on day 184, and the 10%
frost and thaw penetration in a soil subjected to
moisture content soil on day 183.
"normal New England" conditions (i.e., BC-
For all moisture contents of the soil, the freez-
Warm) but without a snow cover. As would be
ing front advances more rapidly through the
expected, the maximum frost penetration is
sand inclusion (Fig. 17). Unlike the BC-Warm
greatest for this case, ∼60 cm (Fig. 16; Table 3).
case, when frost penetration to the base of the
Deepest frost penetration occurs ∼30 days after
sand inclusion coincided with the onset of a
the period of lowest soil surface temperatures.
warming trend, in this situation the soil surface
0
15
10%
17%
10
25%
10
20
5
30
40
0
Surface Temperature
50
Figure 16. Location of the freezing front in
-5
silty soil of 10, 17 or 25% moisture con-
60
tent, with no inclusion present, as deter-
70
-10
mined with one-dimensional numerical
0
40
80
120
160
simulations under BC-Cold conditions.
Day (22 Oct is day 1)
The imposed temperature history of the soil
surface is also shown.
21 Oct
30 Nov
9 Jan
18 Feb
30 March
16


 Previous Page
