that the difference in frost depth at any time is
At a depth of 30 cm, the soil at the edge of the
wide sand inclusion is 0.11C warmer under BC-
zero within the computational accuracy of the
Warm conditions and 0.35C warmer under BC-
one- and two-dimensional simulations. The 16.5-
cm-wide intrusion is narrow enough that it caus-
Cold conditions, compared to 30-cm-deep soil
es minimal disruption of the upward flow of
remote from the inclusion. The temperature dif-
heat.
ference caused by the disruption of heat flow
When the sand inclusion is 5.5 times wider, 91
when the inclusion is present diminishes rapidly
cm, the history of frost penetration under BC-
with lateral distance from the inclusion. It is
Warm and BC-Cold conditions is quite similar to
negligible at a distance of 45 or 55 cm under BC-
that when an infinitely wide inclusion is present.
Warm or BC-Cold conditions, respectively.
Table 2 compares frost depth under the center of
The two-dimensional simulations show that a
sand inclusion of the size (∼16.5 cm wide) associ-
the inclusion on selected days. Heat flow in a ver-
ated with trenching machines has little effect on
Table 2. Frost depths in silty soil of 25%
heat flow and frost penetration due to its small
moisture content on selected days be-
width. As the width of the inclusion increases,
neath inclusions of various widths.
1
Frost
Boundary
Simulation
Inclusion depth*
t = 120 days
condition
Day
type
width
(cm)
0
BC-Warm
140
1-D
0 cm
40.0
2-D
91 cm
32.2
1-D
infinite
31.9
1
BC-Cold
120
1-D
0 cm
53.0
x~4.4 m
Inclusion
2-D
91 cm
46.3
Centerline
1-D
infinite
44.8
2
Inclusion
* Along the vertical centerline of the inclusion.
Edge
tical profile through the center of this wider
3
a.
inclusion is significantly disrupted because the
inclusion is too wide for the heat to effectively es-
cape the influence of the dry, low thermal con-
4
0
10
20
30
40
50
60
70
ductivity sand by flowing around the sides of the
Depth (cm)
inclusion.
2
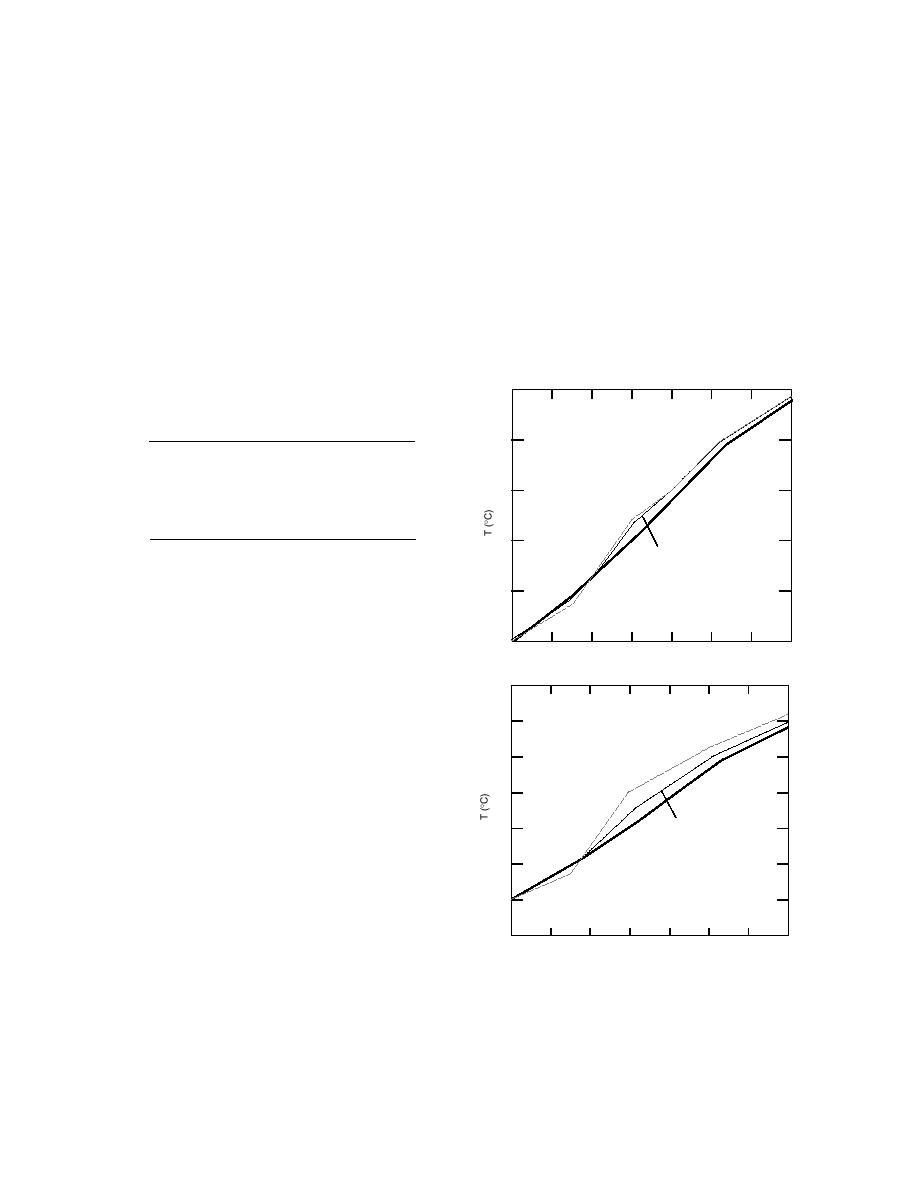
Temperature profiles on days 120 and 140 for
BC-Cold and BC-Warm, respectively, are shown
t = 120 days
1
in Figure 7. On each plot, one profile extends ver-
tically through the center of the inclusion, one is
0
Inclusion
through the edge of the inclusion, and one is ef-
Centerline
fectively in undisturbed soil (4.4 m from the cen-
x ~ 4.4 m
1
ter of the inclusion). Temperature profiles
through a portion of the sand inclusion show a
Inclusion
2
break in slope at depths corresponding to the up-
Edge
per and lower boundaries of the inclusion, and at
3
the frozen/unfrozen condition. These kinks are
realistic, and are due to the discontinuities in
4
thermal properties. In all cases the soil above (be-
b.
low) the inclusion is colder (warmer) than it
5
would be were no inclusion present (see discus-
0
10
20
30
40
50
60
70
Depth (cm)
sion of one-dimensional results, below). On day
120, under BC-Cold conditions, the soil is ∼0.35C
Figure 7. Temperature profiles on selected days at
warmer immediately beneath the center of the
various distances from the vertical midplane of a sand
narrow inclusion but ∼0.9C warmer immediately
inclusion in silty soil (25% moisture content), based
beneath the center of the wide inclusion. On day
on two-dimensional numerical simulations under
140, under BC-Warm conditions, the temperature
BC-Cold (a,b) or BC-Warm (c,d) conditions. The sand
differences are ∼0.15C and 0.3C, respectively.
inclusion is 16.5 (a,c) or 91 (b,d) cm wide.
8


 Previous Page
