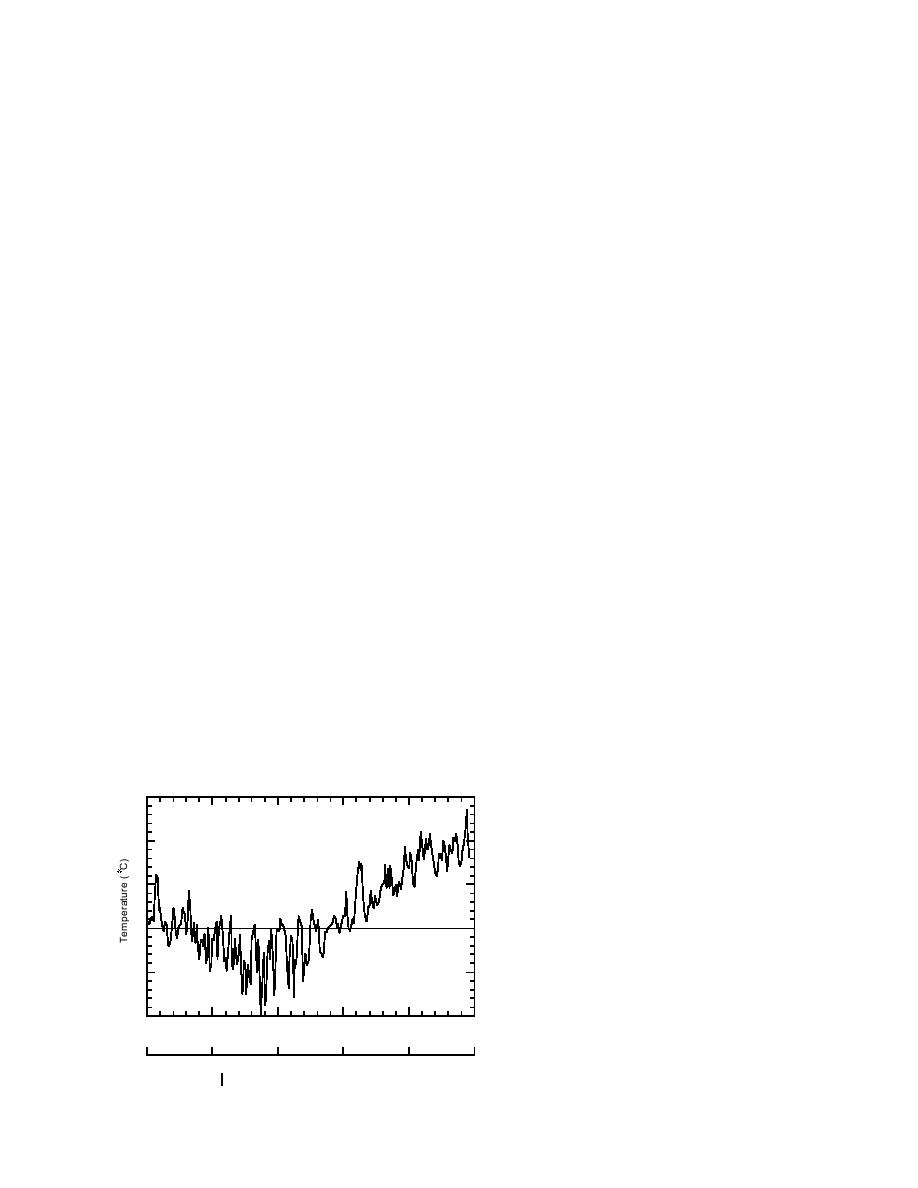
effect" (the difference in frost penetration with
produced a soil surface temperature record that
had no transitions through 0C other than the ini-
and without a sand inclusion present) on the rel-
ative severity of the winter, as expressed
tial freezeup in December and the thaw in April.
through the temperature history at the soil sur-
Figure 5 compares BC-Warm with near-surface
face. The first boundary condition (BC1) is a
soil temperature data from field measurements
simplification of the time-series record of near-
during three winters. BC-Warm is a good repre-
surface soil temperatures for July 1990 through
sentation of the variation in temperature through
June 1991. The soil temperature was determined
the course of a northern New England winter
with a copper-constantan thermocouple located
when frost penetration is moderated by the exist-
within the root zone of the grass cover, a few
ence of a snow cover for extended periods.
mm below the soil surface. The temperature was
The third boundary condition, BC-Cold, is de-
recorded automatically every half hour. These
rived from soil temperature data acquired near
data have been averaged to create a record of
the SOROIDS driveway. Snow is removed from
daily average temperatures of the near-surface
this area throughout the winter when the drive-
soil, from which the 28 October 1990 through 30
way is plowed. The lack of a persistent snow cov-
June 1991 portion was extracted. The resultant
er results in deeper frost penetration and lower
boundary condition applied to the soil surface is
temperatures at depth than at the snow-covered
shown in Figure 4. The averaging and the hour-
location where the soil temperature data used to
ly time steps used in establishing BC1 eliminat-
create BC1 and BC-Warm were obtained. It also
ed some of the occasions when the actual tem-
results in more erratic changes in the temperature
perature of the soil passed through 0C. Where-
of the exposed soil, and in higher near-surface
as the soil surface temperature crosses 0C ~120
temperatures on winter days of high incident
times during this period, BC1 does so only 34
solar radiation. Similarly, under autumn and
times, which simplified the computations while
spring weather conditions, the lack of a vegeta-
retaining the overall character of the data. More
tive cover to shelter the soil results in higher soil
frequent and more rapid freezing and thawing
temperatures at this site.
would have required greater attention to control
BC-Cold is based on soil temperatures at 7.5-
of numerical resolution in both time and space.
cm depth recorded approximately every eight
The second boundary condition, BC-Warm, is
days. (No thermocouple was placed at a shallow-
er depth because of the risk of damage when the
derived mainly from the near-surface soil tem-
driveway was plowed.) This BC, applied to the
perature data for 22 October 1991 to 6 May 1992.
soil surface during simulations, is intended to
The half-hourly data were averaged for a daily
represent a more severe winter condition of gen-
value, and then the daily (averaged) tempera-
erally lower surface temperatures. Alternatively,
ture record was sampled every eight days. Tem-
a comparison of soil temperatures from simula-
perature differences between samples were dis-
tions with BC-Warm and BC-Cold surface condi-
tributed evenly over the eight-day period. This
30
Figure 4. Soil surface temperatures correspond-
ing to BC1. This is the 28 October through 30
June portion of a simplified time series record of
20
measured near-surface soil temperatures at the
SOROIDS field site for July 1990 through June
10
1991.
0
10
20
0
50
100
150
200
250
Day (28 Oct is day 1)
27 Oct
17 Dec
5 Feb
27 Mar
16 May
5 July
1990
1991
6


 Previous Page
