40
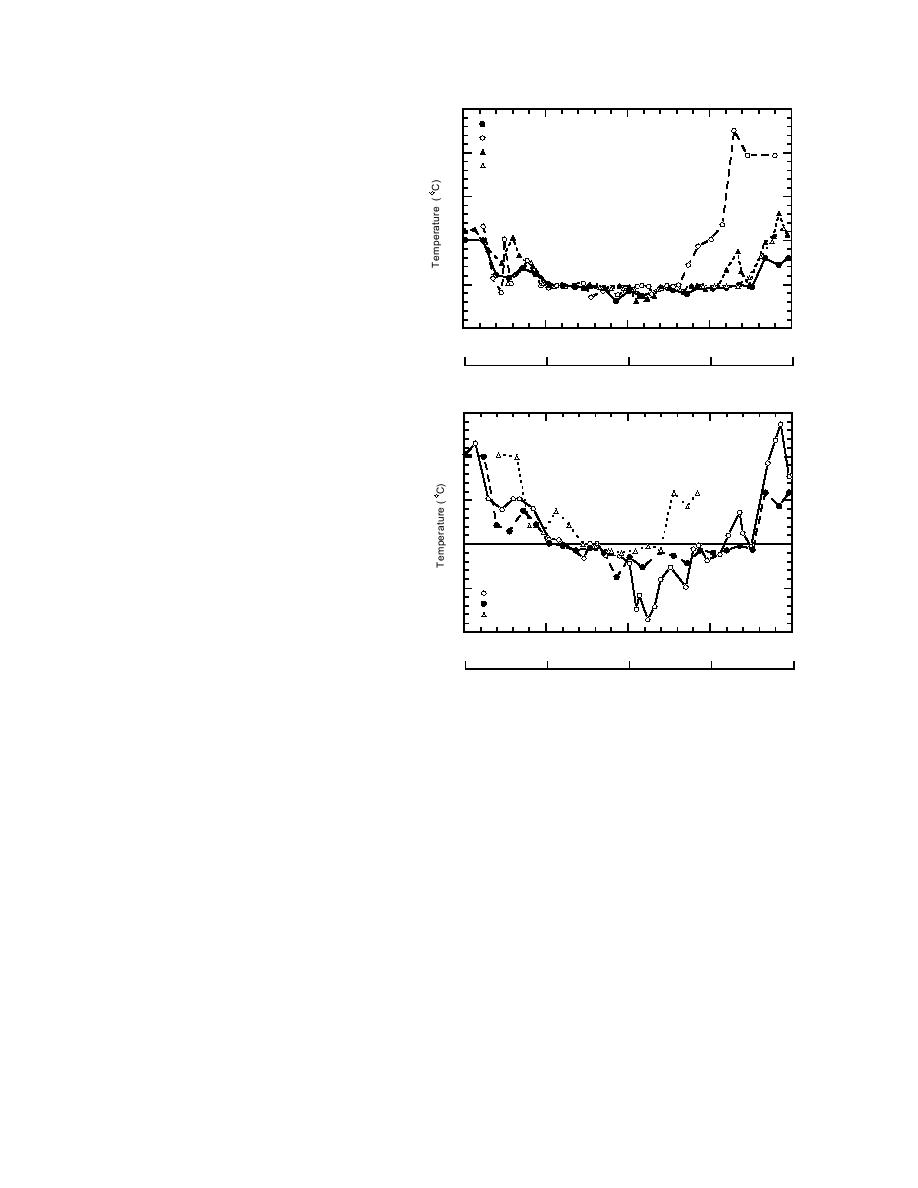
Figure 5. Comparison of BC-Warm and time
BC
series records of measured near-surface soil tem-
Winter 1990-91
peratures for 199091, 199192 and 199293
Winter 1991-92
30
Winter 1992-93
winters. From late March into May, BC-Warm is
cooler than the measured soil temperatures shown in
20
the figure because BC-Warm is derived from a daily
average of soil temperatures measured every half
hour; the nighttime low temperatures "drag down"
10
the daytime high temperatures. The soil tempera-
tures shown for the three winters were single meas-
urements taken during daytime site visits when the
0
near-surface soil was warm because of solar heating.
10
0
50
100
150
200
Day (22 Oct is day 1)
21 Oct
10 Dec
29 Jan
20 Mar
9 May
15
Figure 6. Soil surface temperatures correspond-
ing to BC-Cold, BC-Warm and BC-Warmest.
10
5
0
5
Cold
Warm
Warmest
10
0
50
100
150
200
Day (22 Oct is day 1)
21 Oct
10 Dec
29 Jan
20 Mar
9 May
BC-Cold conditions for a sand inclusion of 16.5-
tions highlights the influence of a snow cover on
or 91-cm width, and soil of 25% moisture con-
frost/thaw penetration in the underlying soil.
tent. The results show that the disruption to
Figure 6 compares BC-Cold and BC-Warm.
frost penetration due to the presence of a sand
The fourth boundary condition, BC-Warmest,
inclusion varies with the width of the inclusion.
represents a shortened winter season during
which the surface soil is colder than 0C for ∼50
This is intuitively reasonable since a two-dimen-
sional simulation accommodates the flow of
days. It is created from BC-Warm by eliminating
heat around the sides of the inclusion, which is
the period corresponding to 1 January through
not realizable with the infinitely wide layers of
17 March. This is based on a comparison of air
one-dimensional simulations. The wider the in-
temperature extremes during the winter at SOR-
clusion is, the more this "by-passing" flow of
OIDS, at a coastal site in Washington state, and at
heat will be possible only for soil locations close
a site in southern England. BC-Warmest is the
to the sides of the inclusion until, eventually,
mildest winter condition used for the simula-
heat flowing along a vertical profile that bisects
tions, in terms of both the duration and the mag-
the inclusion effectively encounters an infinitely
nitude of the cold weather (Fig. 6).
wide inclusion.
A comparison of frost penetration along a
RESULTS OF NUMERICAL SIMULATIONS
vertical profile centered on the inclusion for two
cases, two-dimensional simulations with the
Two-dimensional simulations
16.5-cm-wide inclusion and one-dimensional
A limited number of two-dimensional simula-
simulations with no inclusion present, shows
tions have been done under the BC-Warm and
7


 Previous Page
