frozenthawed status of deeper soil. Surficial
a. 7.5 cm
freezing or thawing will not have the significant
0
impact on electromagnetic sensor system perfor-
mance that deeper penetration of the freezing or
thawing front will.
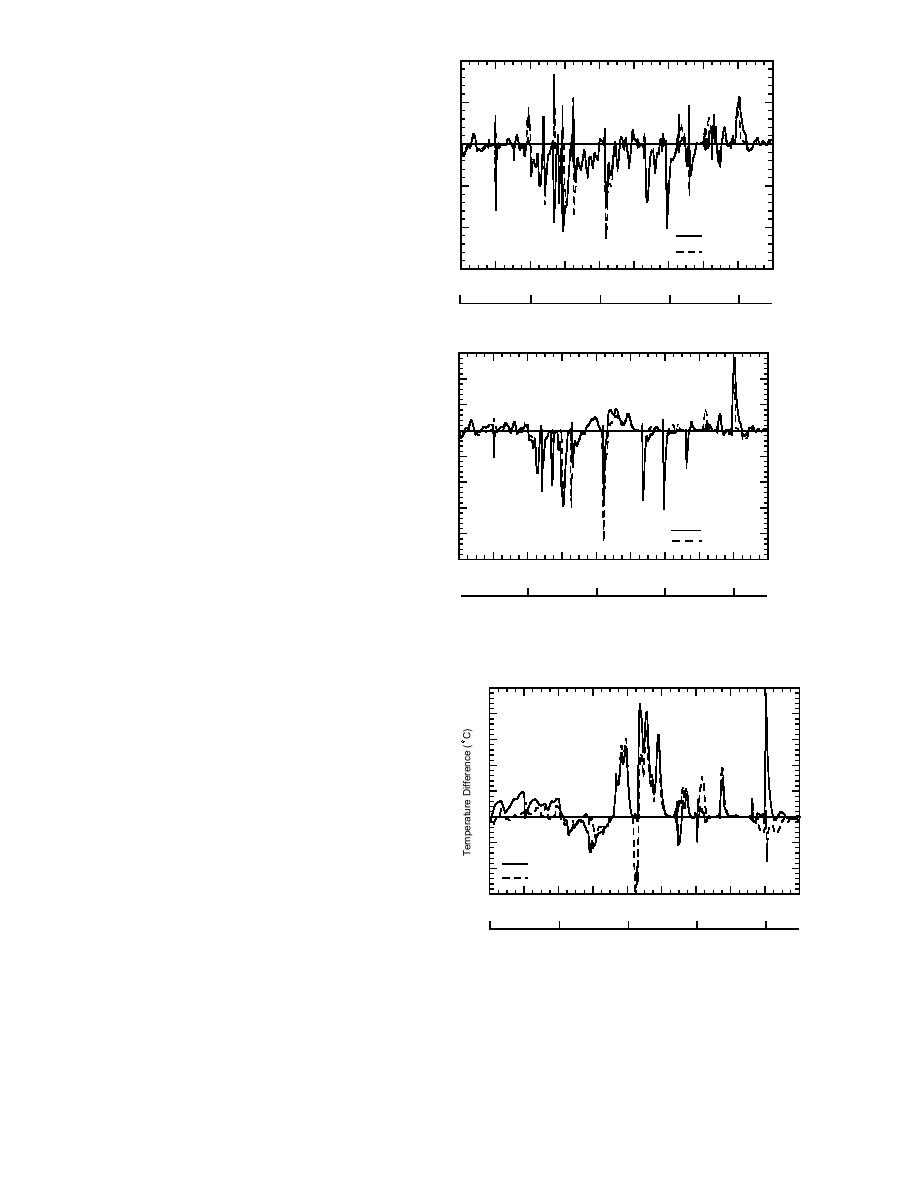
The effect of a sand inclusion on soil tempera-
ture is easily seen in Figure 9. The difference in
2
Sand
soil temperature, with and without an inclusion,
Sandy Soil
is plotted for both types of inclusions (sand and
sandy soil) and three depths. Above the inclusion
0
40
80
120
160
Day8(28 Oct is day120
1)
0
40
0
160
(7.5 cm, Fig. 9a) the soil is generally cooler when a
sand inclusion is present, as indicated by a nega-
7 Oct
6 Dec
15 Jan
24 Feb
5 April
tive temperature difference. The material of the
inclusion makes a difference only in early winter
(days 53 to 60), when following a period of sus-
tained below-freezing temperatures, the soil sur-
face cycles between being frozen and unfrozen.
b. 22.5 cm.
During this period, soil above an inclusion of
sandy soil is sometimes warmer than it would be
in the absence of the inclusion, while soil above
an inclusion of sand is sometimes colder than it
would be without the inclusion. Subsequent tem-
perature differences for both types of inclusion
are consistent in sign and generally similar in
Sand
magnitude (less than 1C different). That the de-
Sandy Soil
pendence of the disruption in heat flow on the
40
80
120
160
40
Day (28 Oct is day11)0
80
2
160
material of the inclusion lessens during the win-
ter is a consequence of the freezing of the inclu-
Oct
6 Dec
15 Jan
24 Feb
5 April
sions. Unfrozen, the sand and sandy soil have
significantly different thermal conductivities,
with that of the sandy soil being 27% higher; fro-
zen, the two materials' conductivities are similar
2.5
(Table 1). While unfrozen, sand would less readi-
ly (than sandy soil) conduct heat from depth to
22
c. 37.5 cm
the overlying soil to counteract cooling events ini-
1.5
tiated at the soil surface.
Below the inclusion, the soil is generally
11
warmer (positive temperature difference). The
0.5
temperature difference at 37.5-cm depth (Fig. 9c)
is most dynamic in midwinter (days 75 to 100).
00
During this period, for the case of no inclusion,
-0.5
the soil shows large fluctuations in temperature.
Sand
-11
Soil below an inclusion does not experience tem-
Sandy Soil
perature changes of similar magnitude. Instead, it
-1.5
0
40
80
120
160
160
is warmer (positive temperature difference) fol-
0
40
80
120
Day (28 Oct is day 1)
lowing a cooling episode and colder (negative
27 Oct
6 Dec
15 Jan
24 Feb
5 April
temperature difference) following a warming epi-
sode. This is a consequence of the temperature
Figure 9. Temperature differences (inclusion minus no
perturbations not propagating as readily through
inclusion) obtained from one-dimensional numerical
the low conductivity frozen inclusion (sand or
simulations of heat flow in a silty soil (17% moisture
sandy soil) to the soil beneath.
content) with no inclusion, with a sand inclusion
The temperature differences are largest when
present, or with a sandy soil inclusion present, under
the temperatures of the soil and the inclusion are
BC1 conditions. At the 22.5-cm depth, the temperature
compared. At a depth of 22.5 cm, which corre-
comparison is between sand or sandy soil and silty soil.
10


 Previous Page
