form initial temperature approximately equal to
tion at contact points between soil particles may
the yearly average at 60 cm and assuming that
decrease upon freezing of the soil because water
at the contact points is removed to form ice in the
the temperature profile at a depth of ~20 m re-
soil pores (Farouki 1981, and others). Since the
mains flat. By the end of the simulation a stable
thermal conductivity of air is approximately one-
yearly pattern of temperature profiles for soil
twentieth that of unfrozen water, the loss of
depths of 0.6 to 20 m had become established
water from contact points causes the thermal con-
(Fig. 3), as well as a stable temperature value at
ductivity of the frozen sand or sandy soil to be
depth; any transient startup effects and influences
less.
of initial conditions had been filtered out.
The final temperature profile used to initialize
the meshes consists of the simulated profile for
Initial temperatures
The one- and two-dimensional meshes were
day 300 (28 October) from Figure 3 for the depth
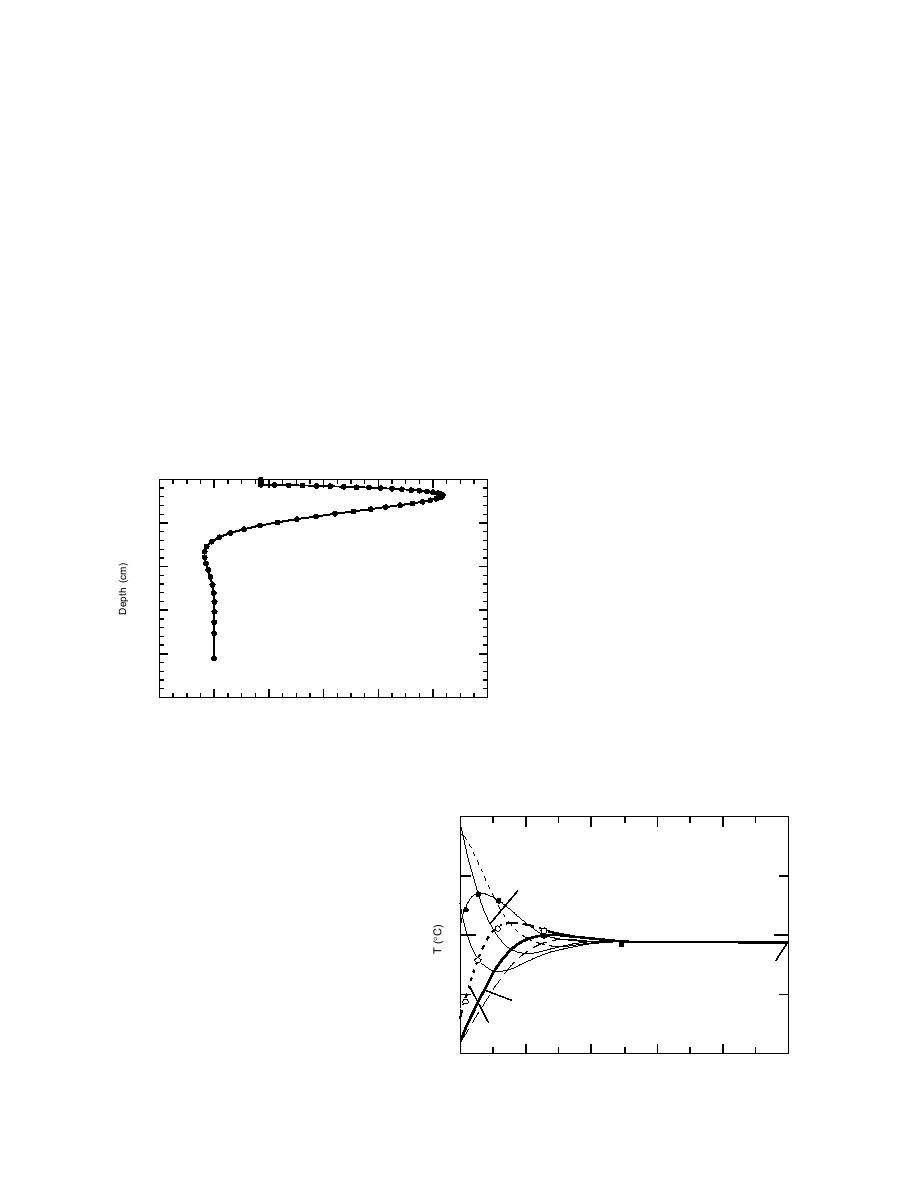
initialized with the temperatures plotted in Fig-
range 0.6 to 20 m spliced to a constant tempera-
ure 2 by depth. As no measured soil tempera-
ture profile from 0.6 m to the surface. The flat,
tures were available for depths greater than 60
near-surface profile is a computational conve-
cm, a temperature profile for depths of 0.6 to 20
nience that disappeared quickly and did not sig-
m was calculated as follows. Thermal properties
nificantly affect the results.
consistent with a moisture content of 17% were
assigned to the soil in that region. Daily averages
Boundary conditions
of SOROIDS soil temperatures at 60-cm depth, re-
Four boundary conditions for the temperature
corded half-hourly throughout 1990, were used
of the soil surface (0 cm) have been derived from
as an upper boundary condition to drive the cal-
SOROIDS soil temperature data. The different
culations over a one-year time span. This was re-
surface boundary conditions were created to in-
peated for a 20-year time period, assuming a uni-
vestigate the dependence of the "sand inclusion
1000
1500
2000
Figure 2. Initial temperature condition for the
2500
numerical simulations, by depth.
8
9
10
11
12
13
14
Temperature ( C )
Temperature (C)
20
250
200
300
10
8.99 C
150
100
Figure 3. Calculated soil temperature profiles for
50
depths of 0.6 to 20 m on selected days (day 1 is 1
January). The temperature profiles were obtained
350
from numerical simulations of heat flow at depth
0
400
800
1200
1600
2000
during a 20-year period based on measured soil
Depth Below 60 cm (cm)
temperatures at a depth of 0.6 cm.
5


 Previous Page
