NUMERICAL MODELING OF HEAT FLOW
decreases as the soil temperature drops below
0C, the performance of the electromagnetic sen-
Computer program
sor system improves when the soil is frozen. An
A version of XYFREZ (O'Neill 1987) is used to
example of seasonal variation in the response
simulate conduction of heat in idealized situa-
of such a sensor system as the frozenunfrozen
tions of soil with and without a sand inclusion.
status of the surrounding soil changes is given in
The program XYFREZ uses finite elements in
Appendix A.
space and finite differences in time to model
Any situation that delays the initial freezeup
heat conduction. Latent heat effects due to a
of the soil above the sensor cables has a negative
phase change in water within the soil or sand
impact on the reliability of the sensor system.
are included through a singularity in the heat
Similarly, any situation that causes the soil to
capacity of each material. Moisture diffusion
transition through numerous freezethawfreeze
due to a temperature gradient in the materials is
episodes during the winter results in inconsistent
not considered. The numerical formulation has
performance by the sensor system. Therefore,
been tested with good agreement against some
when field measurements at a Vermont site indi-
exact solutions (O'Neill 1983, 1991) and some
cated that, under apparently identical physical
laboratory measurements of soil freezing.
conditions, both temperature profiles and the
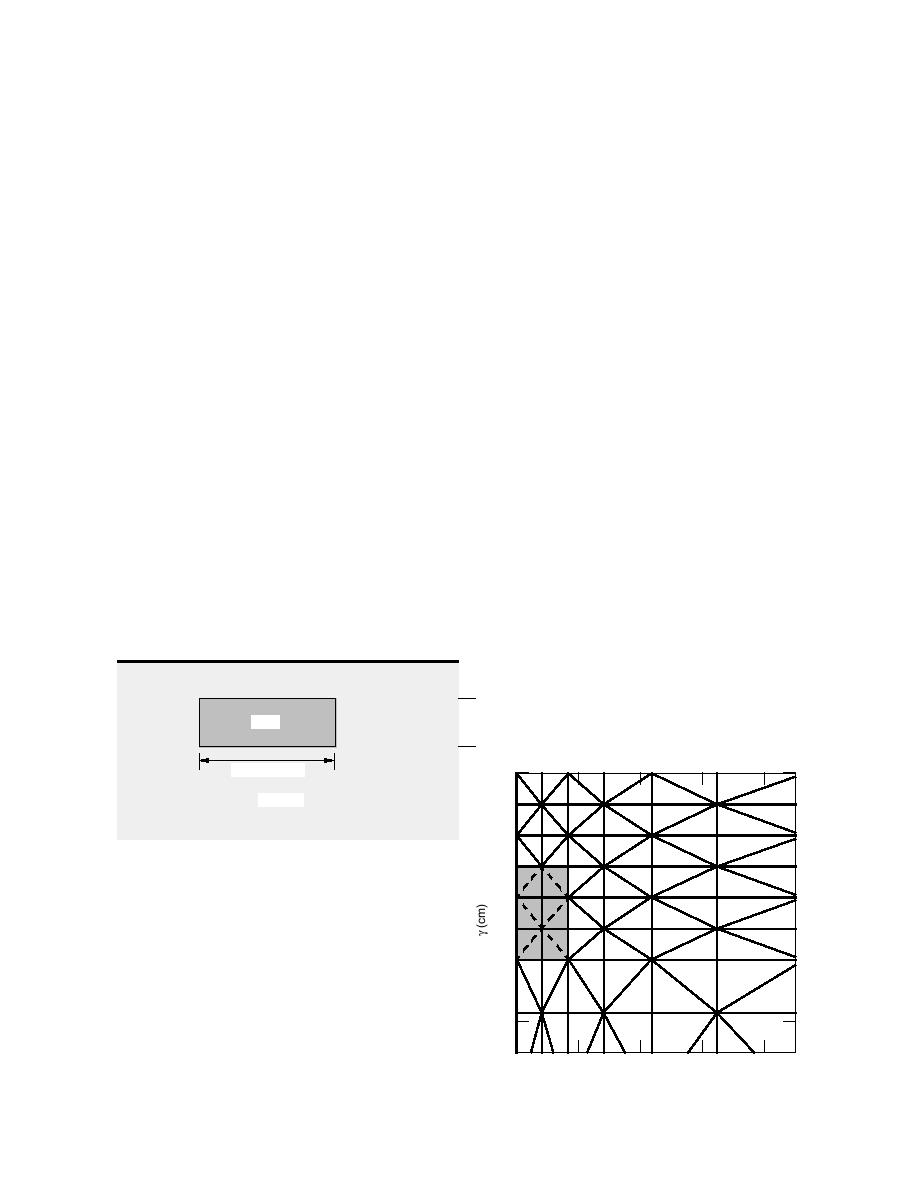
Both one- and two-dimensional simulations
number of freezethaw transitions were different
are conducted. For the two-dimensional studies
for a sandy loam soil with a sand inclusion com-
(Fig. 1a, b, c), the left-hand side of the mesh cor-
pared with nearby soil without a sand inclusion,
responds to a vertical plane through the center
a series of numerical modeling experiments of
of the sand inclusion. The half-width of the sand
heat flow in soil with and without a sand inclu-
inclusion is initially set at 8.25, a common con-
sion was begun. Because sand must always be
figuration with sensor systems, and subsequent-
used to surround sensor cables when the local
ly increased to 45.5 cm to examine the lateral ex-
soil is clay or any other high electrical conductivi-
tent of the disruption of frost and thaw penetra-
ty soil, the modeling was restricted to the case of
tion in the soil adjacent to a wider sand inclu-
a silty soil, a situation for which security design-
sion. For the one-dimensional studies, the sand
ers have a choice of whether to place the sensor
inclusion is treated as a 15-cm-thick layer that is
cables in sand.
Soil Surface
15 cm
Sand
30
Coarse Resolution Mesh Detail
16.5 or 91 cm
0
Silty Soil
10
a.
20
)
Figure 1. Cross-section (a) and mesh (b, c) of the soil
30
with sand inclusion model for two-dimensional simula-
tions. Only the near-surface portion of the mesh is shown.
The half-width of the sand inclusion, shown stippled, was
40
8.25 (b) or 45.5 cm (c). x is distance from the centerline of
the inclusion, and γ corresponds to depth. dCross-section
of the soil/sand/soil layered section representing the physi-
0
10
20
30
40
cal situation of the one-dimensional simulations.
b.
X (cm)
2


 Previous Page
