0.1
0.18 30, 60
0.09
0.16
0.08
0.14
| Etot|/E
o
0.07
0.12
45, 45
60,.06
0
0.1
30
0.05
0.08
0.04
0.06
0.03
0.04
0.02
0.02
8
8
8
8
8
0
1 10
2 10
3 10
4 10
5 10
f
(Hz)
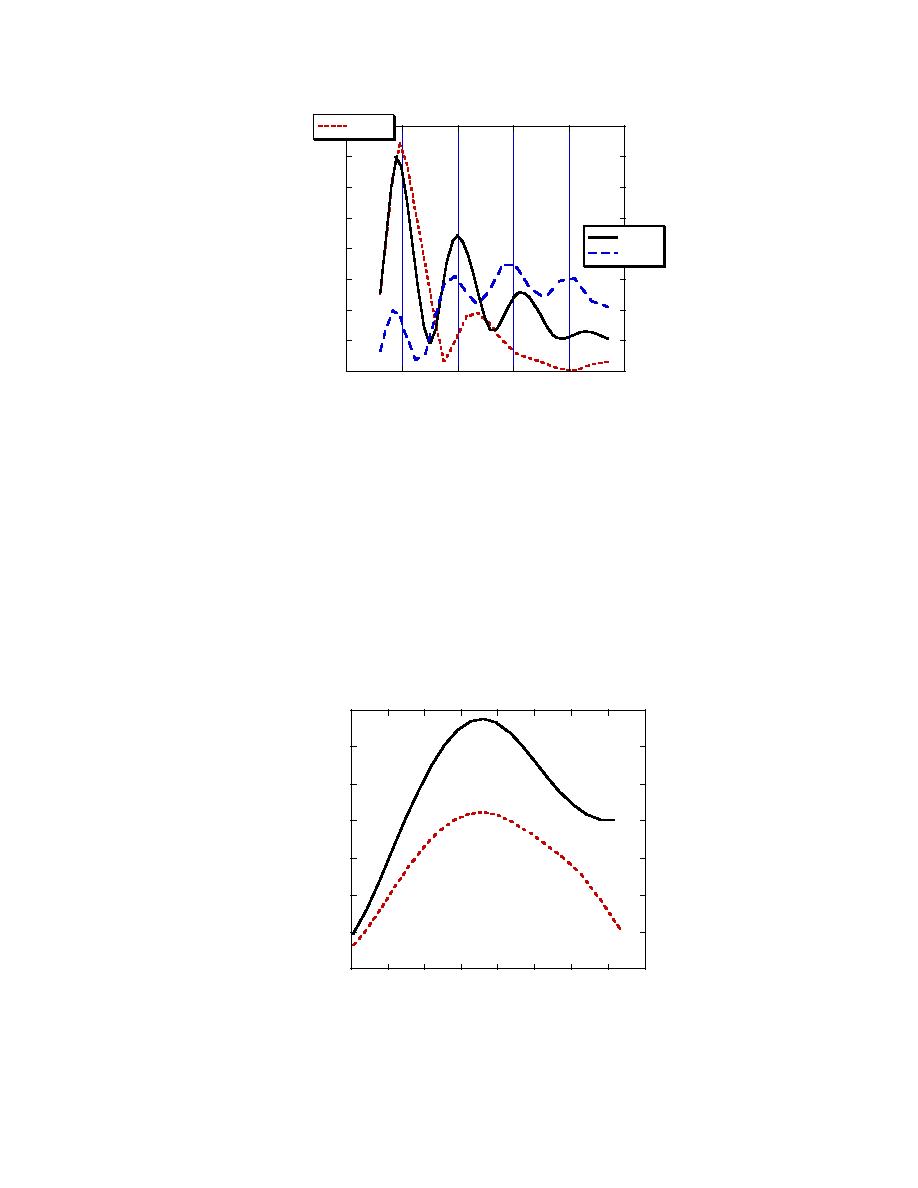
Figure 16. Normalized scattered E field above target for various
projectile inclinations and rotations θd, θx.
The appearance of resonance peaks in the patterns
The peak in the curve occurs at the ka value one would
can provide essential information about target geom-
expect for an infinitely long circular cylinder with ra-
etry. But they can also lead the surveyor astray. The
dius a, when creeping waves around the target inter-
positions where these peaks appear depend both on fre-
fere constructively with direct backscatter from the front
quency and vantage point. Thus, for example, low fre-
of the target. Thus a plot of results for this target orien-
quencies coming from an antenna to the side of the tar-
tation implicitly reveals the value of a. We note that the
get (the low-frequency portion of the incident beam is
tapering down of target cross section into its nose does
wider than the higher frequency) could provoke strong
not seem to affect these results, i.e., a refers to the ra-
peaks. However, when the antenna has been moved,
dius of the uniform section of the target cylinder.
0.14
θ = 0, z = 0
d
a
0.12
0.1
| E |/E
y
o
0.08
0.06
θ = 45 , z = 0.72
o
d
a
0.04
0.02
0
0.2
0.4
0.6
0.8
1
1.2
1.4
1.6
1.8
ka
Figure 17. Normalized scattered E field when projectile axis is
in (x,z) plane, from different vantage points Za, with different
25


 Previous Page
