718 ft
763 ft
35 ft
7 ft
0
0
1
1
2
2
Transect I
Transect L
240
252
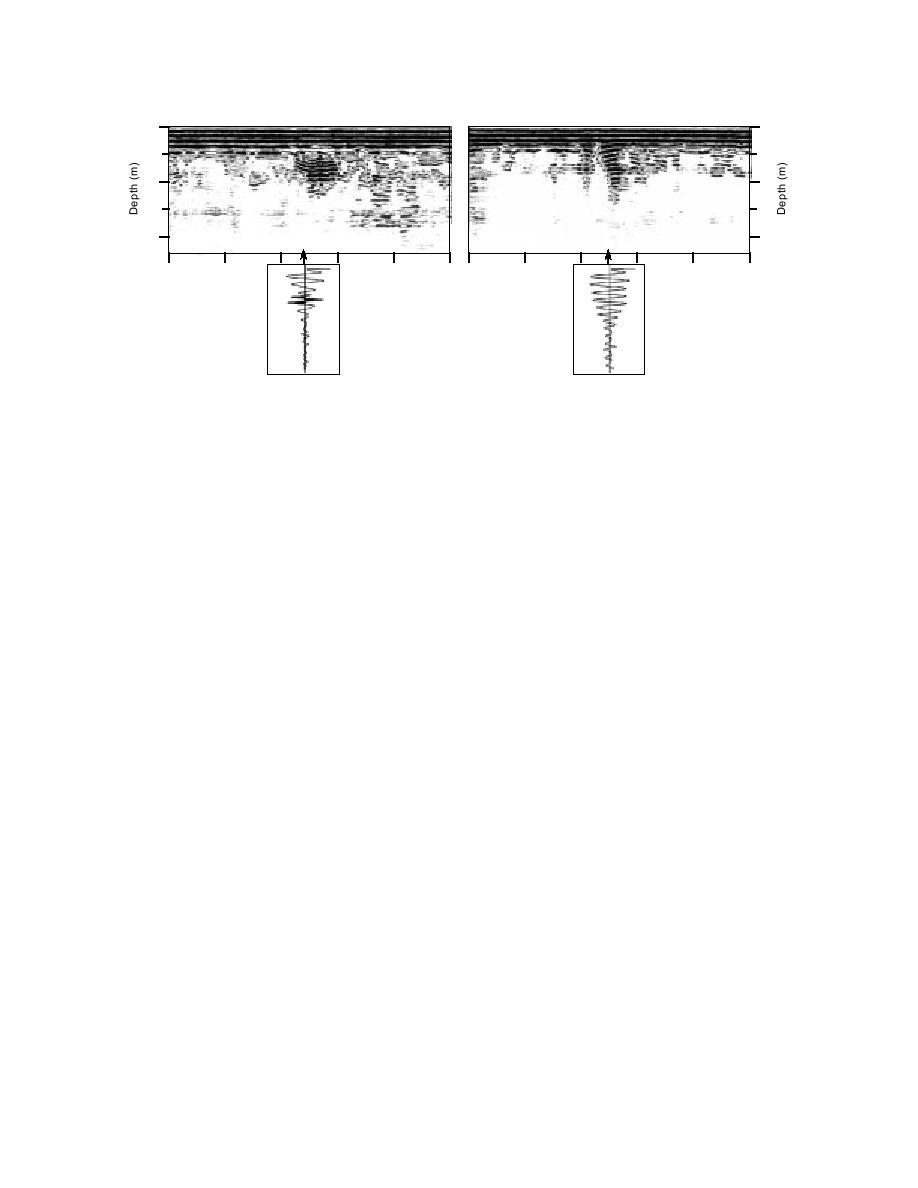
e. Transects I and L.
Figure 7 (cont'd). Selected target responses within segments extracted from the 300-MHz pro-
files and sample traces containing diffracted or reflected wavelets (darkened areas). The dis-
tances along each transect are shown at the top of the segments. Each segment is 500 traces
long, and trace number is indicated on the sample traces. The lower horizontal scale is in 100-
trace increments. The depth scale is based on an ε′ of 10.4.
Grid survey: 600 MHz
within which the first few half-cycles have the metal
We conducted this survey along four of the 14 grid
response waveform (transect C, right), while other tar-
lines. We show profile segments containing the seven
gets exhibit resonances within the direct coupling and
strongest target responses (Fig. 9) in a nonlinear for-
cannot be similarly analyzed (transect G, right; transect
mat because the amplitudes of all the returns are
L). These latter resonances occur where targets are
extremely weak, hence the appearance of much more
extremely close to the surface; i.e., where target mul-
noise (gray speckle patterns) in the profiles than
tiple reflections occur before soil attenuation dampens
appeared at 300 MHz.
them significantly. In all cases, diffraction asymptotes
Small segments of diffractions are apparent in all
are so highly attenuated as to be either barely visible
the target responses in Figure 9; the lack of asymptotes
for small targets (transect G, left), as was seen in the
indicates the high signal attenuation. Almost all of the
control studies of Figure 4, or not visible at all where
responses have well-defined wavelets that exhibit the
they should occur at the ends of short reflection segments
proper phase for a high-impedance target. These
recorded above more extended targets (transect C, left).
responses originate from depths less than about 0.5 m
We give probable interpretations for the target
and would not have been resolved from the direct cou-
responses seen along transect C (left side) and along
pling of the 300-MHz system. Although the time range
transect K (left side) in Figure 8. The response along
is only 30 ns, very few target responses occurred at
transect C is about 7 ft (2.1 m) long, which is close to
greater than about 20-ns range. Therefore, the penetra-
the length of a heavy bomb (1.6 m). The location of
tion of this frequency in this soil was limited to less
this response (533572 ft) is marked in Figure 3b as
than 1 m deep.
having such ordnance. The more complex response
along transect K is about 12 ft (3.7 m) long and occurs
Distribution of ε′
in a section marked as having several medium-size mor-
We compared the more prominent diffractions seen
tars and projectiles. The JPG UXO ordnance brochures
in both the 300- and 600-MHz surveys with model
show many of these projectiles to be about 2 ft (0.6 m)
hyperbolas to produce distributions of ε′ and to com-
long. We therefore speculate that this transect segment
pute an effective mean permittivity value for the over-
spanned a series of close projectiles.
12


 Previous Page
