Distance Along Line F (ft)
Direct Coupling
940
930
920
910
900
890
880
870
949
859
0.0
0
10
20
1.0
30
{
40
2.0
Noise Bands
50
0
0.0
10
20
1.0
30
40
2.0
50
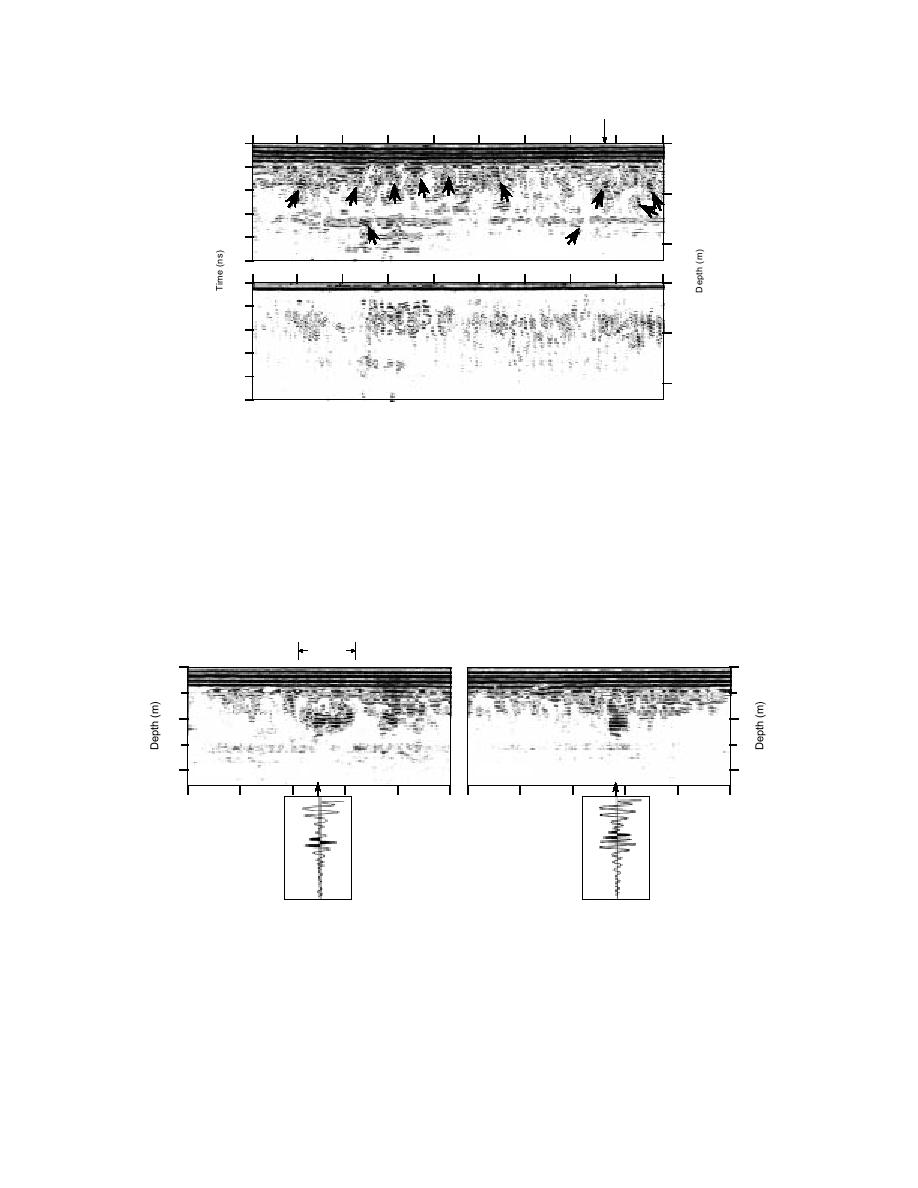
Figure 6. Sample segment of a 300-MHz profile (top) and the result of apply-
ing a background removal filter (bottom). The arrows indicate strong targets.
The short filter window required to alleviate the erratic character of the back-
ground noise decreases the prominence of the target responses.
8 ft
(2.4 m)
533 ft
572 ft
629 ft
672 ft
0
0
1
1
2
2
Transect C
Transect C
251
283
a. Transect C.
Figure 7. Selected target responses within segments extracted from the 300-MHz profiles, and
sample traces containing diffracted or reflected wavelets (darkened areas). The distances along
each transect are shown at the top of the segments. Each segment is 500 traces long, and trace
number is indicated on the sample traces. The lower horizontal scale is in 100-trace incre-
ments. The depth scale is based on an ε′ of 10.4.
10


 Previous Page
